Facebook
 Twitter
 Pinterest
 Copy Link
2019 Football Schedules, Venues, Recipes & Tips…


Are you ready for some football? Scroll down for printable schedules, favorite places to watch, game-day recipes and awesome tailgating hacks…


Can’t make it to the stadium? Here are some tried and true local hot spots where you can catch the game in good company. All of these venues are family friendly for your little 12s, too!
1. Tavern Hall, Bellevue
Right in the heart of Bellevue Square, Tavern Hall offers 30 (!!) flatscreen TVs and 4 shuffleboard tables. Brick oven pizzas and pretzels accompany the 20+ different beer varietals on tap. All-ages restaurant + bar seating.

Photo courtesy of tavern-hall.com
2. Buckley’s in Belltown, Seattle
A 5-foot projection screen accompanies the 22+ TVs and 24 beer tabs in this family-friendly favorite. Check out the Queen Anne location as well (complete with a 10-foot projection screen!).

Photo courtesy of buckleyspubs.com
3. Flying Pie Pizzeria, Issaquah
If you’re watching the game with kids (or just love good pizza), Flying Pie in Issaquah offers a full arcade, mounted TVs, pitchers of local beer and plenty of 1980s nostalgia. Gluten-free and vegan options provide a modern twist on the classic pizzeria.
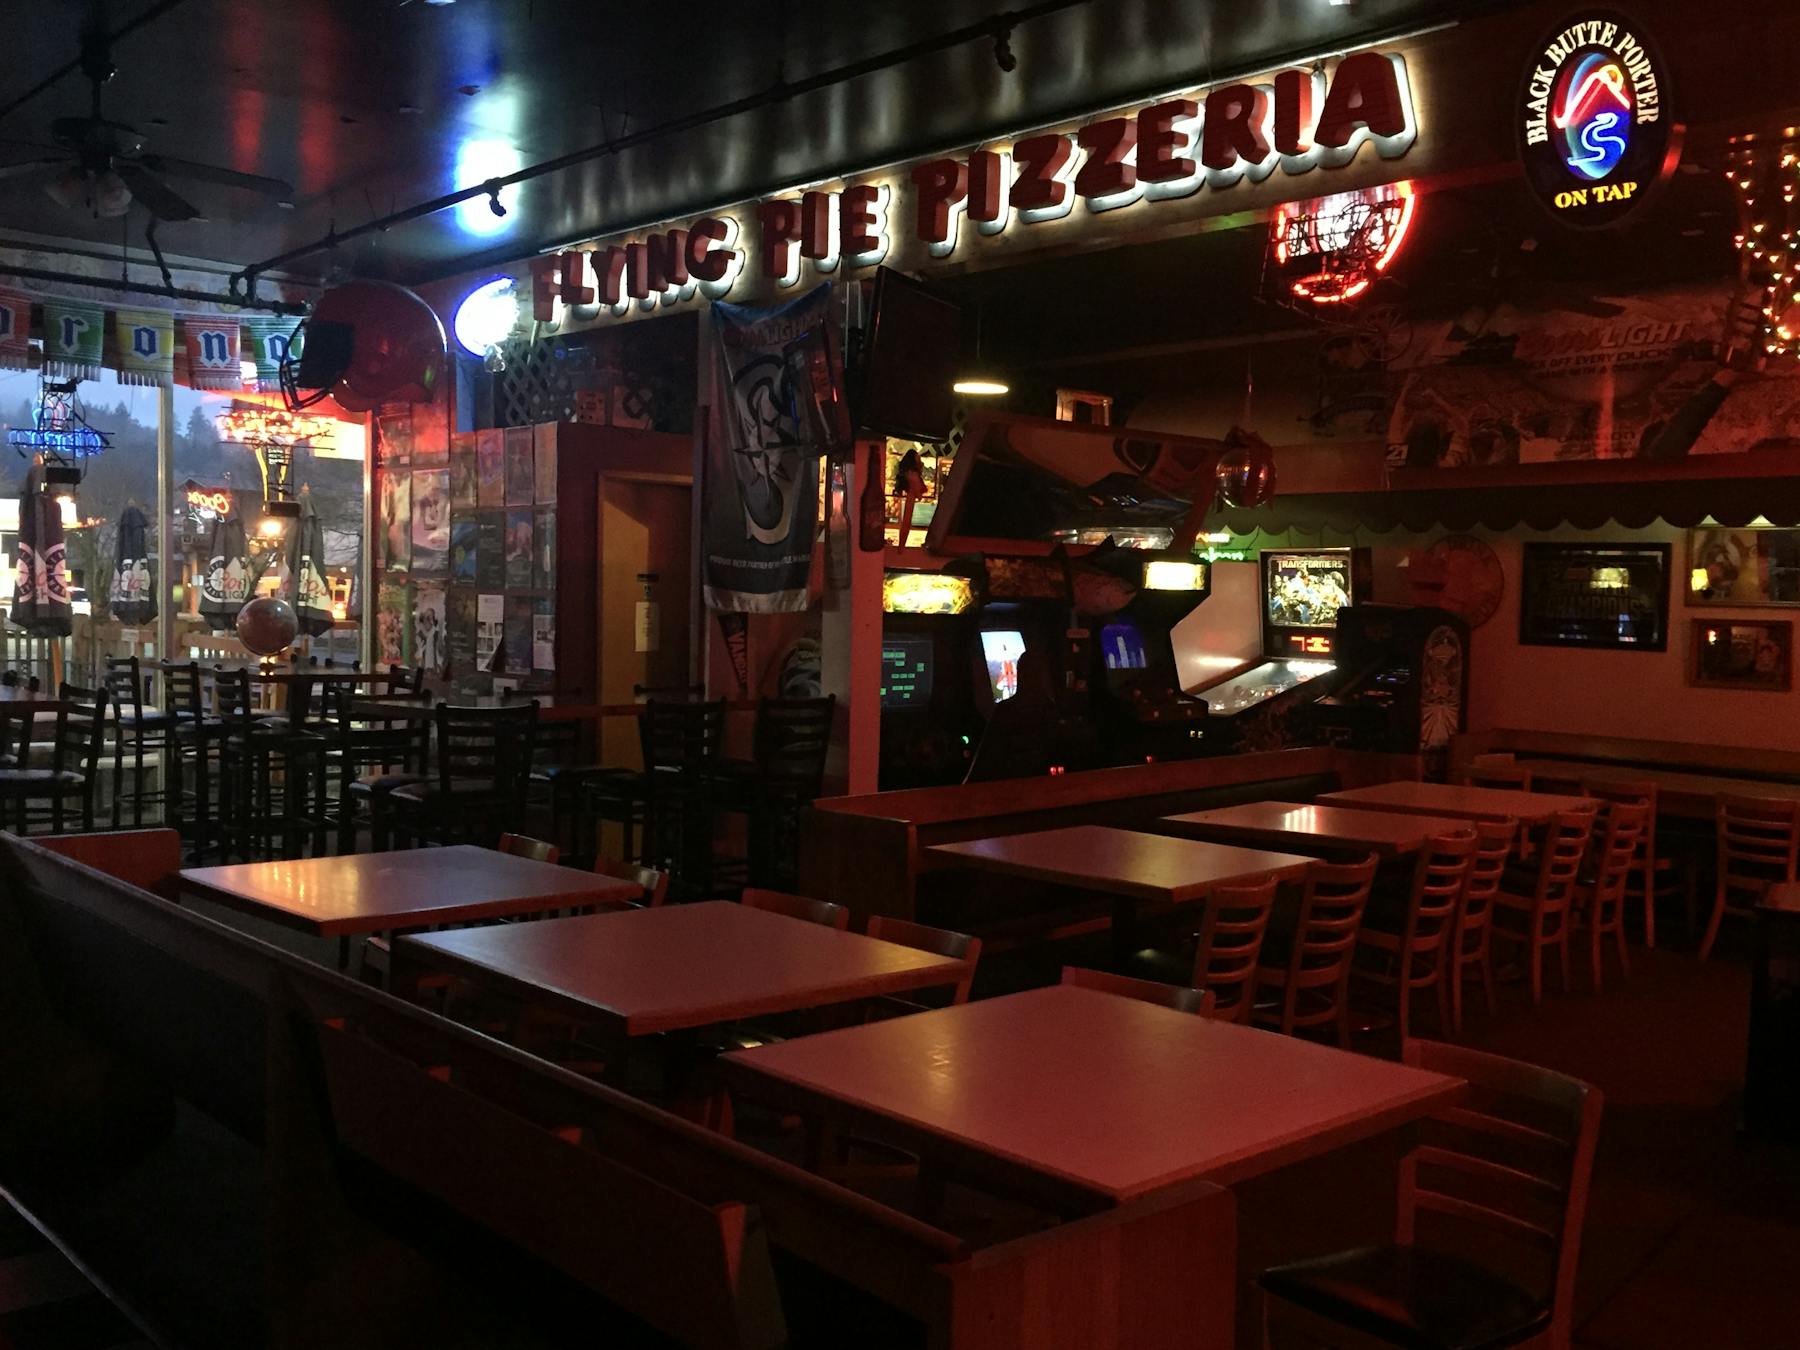
Photo courtesy of flyingpiepizzeria.com
4. Elliott Bay Brewery & Pub, West Seattle
Touted for its organic handcrafted ales, great food and kid-friendly atmosphere, the Elliott Bay brew pub also broadcasts local games on its mounted TVs. Don’t miss the local Stout Wort ice cream (made right across the street at the Husky Deli). Take a victory lap–or burn off all your stress eating–at nearby Alki Beach.

Photo courtesy of 5280lensmafia.wordpress.com
5. McMenamins Woodshop at Anderson School, Bothell
Northeast of Seattle, this converted schoolhouse in newly re-imagined downtown Bothell is well worth the drive. Enjoy shuffleboard, pool or pinball while you catch all the action on big screen TVs. Bribe kids with post-game pool time in the incredible North Shore Lagoon (with its own Tiki pub for mom or dad).
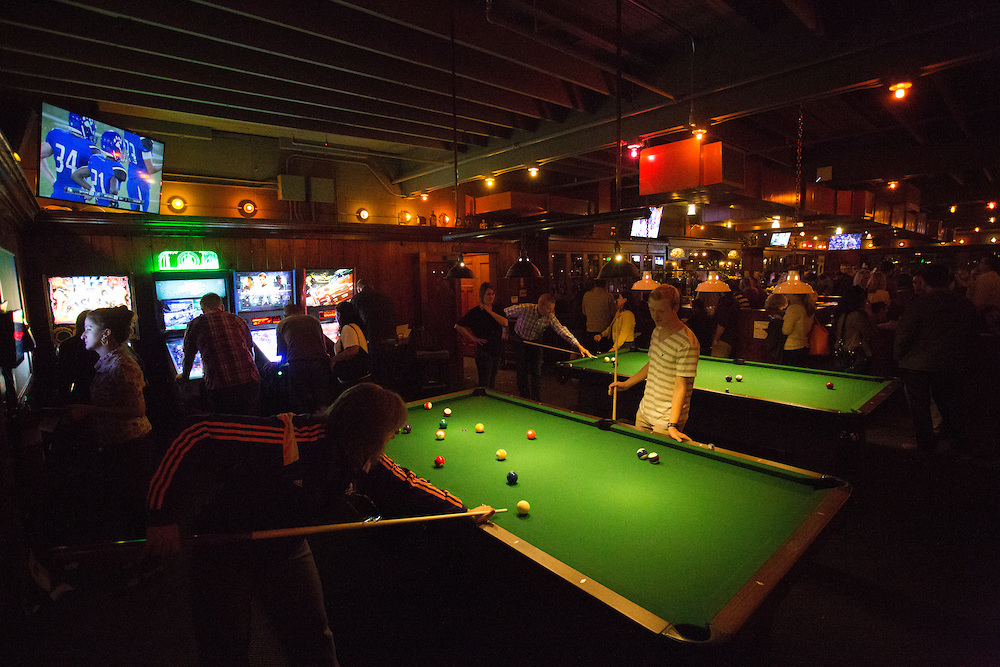
Photo courtesy of parentmap.com.


ABOUT WINDERMERE MERCER ISLAND
We earn the trust and loyalty of our brokers and clients by doing real estate exceptionally well. The leader in our market, we deliver client-focused service in an authentic, collaborative and transparent manner and with the unmatched knowledge and expertise that comes from decades of experience.

© Copyright 2019, Windermere Real Estate/Mercer Island. Main photo courtesy of https://joenicholsonphotos.wordpress.com.
Kicks for Kids Shoe Drive Now Through August 15th


WHAT: Windermere’s Kicks for Kids event is a back-to-school sneaker drive for low-income youth, distributed through the Eastside Baby Corner.
WHY: Kids from struggling families are in need of back-to-school shoes that fit. When kids feel good about their appearance, it improves both their self-esteem and their performance in school.
WHEN: Formal shoe collection will take place through August 15, 2019.
WHERE: Windermere Mercer Island is the collection point where you can drop off new athletic shoes or sneakers (youth sizes 1-6 and adult sizes 7-9) or a gift card.
WHO: Sponsored by Windermere Mercer Island in partnership with the Eastside Baby Corner, located in Issaquah, Washington.
Windermere Mercer Island invites you to help in its back-to-school sneaker drive, known as the Kicks for Kids Shoe Drive, which serves the local communities to connect low-income youth with shoes for the upcoming school year. This year, we’re connecting once again with the Eastside Baby Corner, which is an amazing organization that helps kids thrive by providing resources and essentials with their 51 partner agencies – 26 of which are access to services through schools. The Eastside Baby Corner partners with charitable organizations throughout the Greater Seattle Area and helps them with the resources they need to best assist local families in need. Click here to go above and beyond the shoes with their back-to-school wish list!
Help us make sure every child has a new pair of shoes for school!

ABOUT WINDERMERE MERCER ISLAND
We earn the trust and loyalty of our brokers and clients by doing real estate exceptionally well. The leader in our market, we deliver client-focused service in an authentic, collaborative and transparent manner and with the unmatched knowledge and expertise that comes from decades of experience.
© Copyright 2019, Windermere Real Estate/Mercer Island
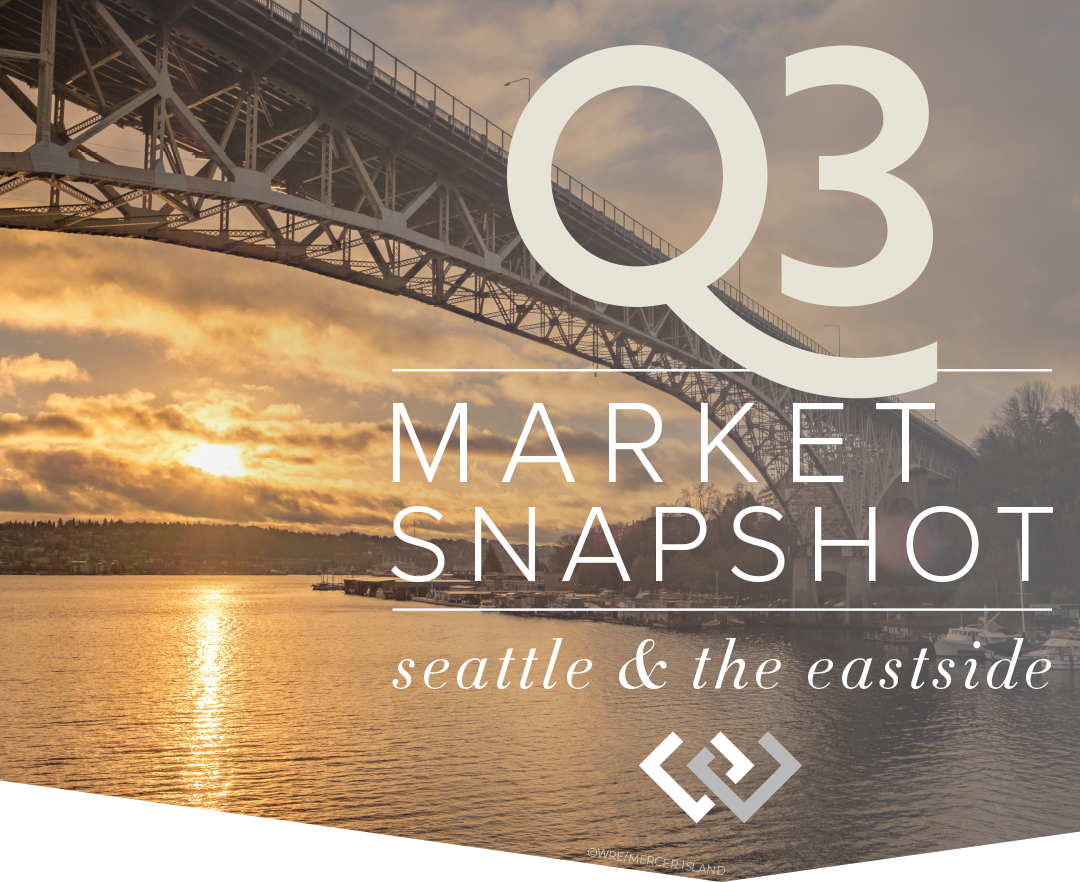
Q2 2019 Reports: Market Update

Changes in the home lending environment drove down mortgage interest rates in Q2 to their lowest levels in years, giving buyers more buying power for their money and stimulating demand for available homes on the market.
The number of homes for sale is up markedly, especially in Seattle, as is the number of closed sales, with low interest rates and high local incomes taking much of the credit for the market activity. Sale prices have remained modest as buyers feel more cautious about overpaying for a home at or near the cyclical market peak.
As stated in earlier reports, the market has much to offer buyers and sellers this year. We believe those looking to make a move in the next few years should do so this year when they can still secure incredibly affordable mortgage financing. Today’s buyers should be prepared to stay in their home at least five years. Home sellers moving to lower cost regions may also benefit from selling now. We know that every situation is unique, and we are here to help you evaluate your personal real estate holdings and purchase strategy.
Click or scroll down to find your area report:
Seattle | Eastside | Mercer Island | Condos | Waterfront
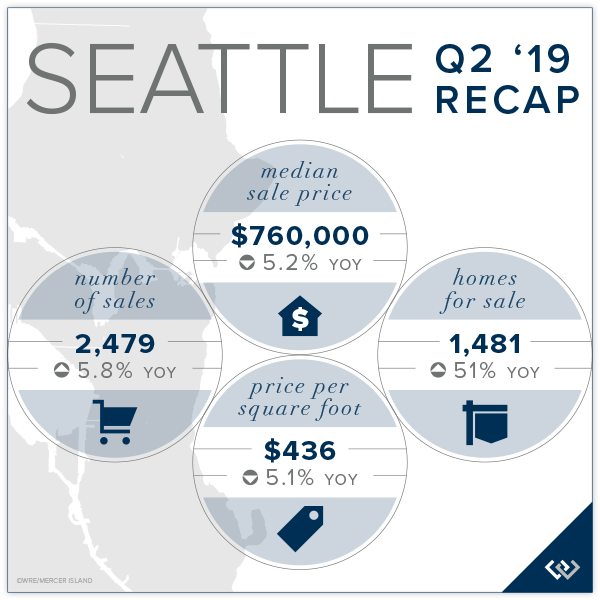
SEATTLE
The number of homes for sale continued to rise across Seattle. West Seattle and Richmond Beach/Shoreline experienced the greatest velocity in number of sales. Seattle’s overall Median Sale Price was up 4.8% from Q1 to $760,000, but down 5.2% from Q2 2018. The Average $ Per Square Foot was down 5.1% from Q2 last year to $436. North Seattle, Queen Anne/Magnolia and West Seattle all performed better than the average in Q2. Seattle homeowners have seen a 61% increase in the Median Sale Price over the past five years.
Click here to view the complete report for a neighborhood by neighborhood breakdown of Average Sale Price, size, and number of homes sold.

EASTSIDE
The Eastside cities of Bellevue, Kirkland, and Redmond have become the epicenter of tech growth planned over the next few years. Recent announcements from Amazon, Google, Facebook, and Microsoft, coupled with light rail coming in 2023, have made the Eastside the place to be. The Eastside’s Median Sale Price was up 1.9% from Q1 to $945,000, but down 1.6% from Q2 2018’s peak of $960,305. The five-year Eastside median price trend is up 53% since 2014.
Mercer Island rebounded in Q2 from a poorly performing Q1 while Kirkland and South Eastside fared better than average. A total of 2,334 Eastside home sales closed in Q2, up 1.2% from Q2 2018.

Click here for the full report and neighborhood-by-neighborhood statistics!

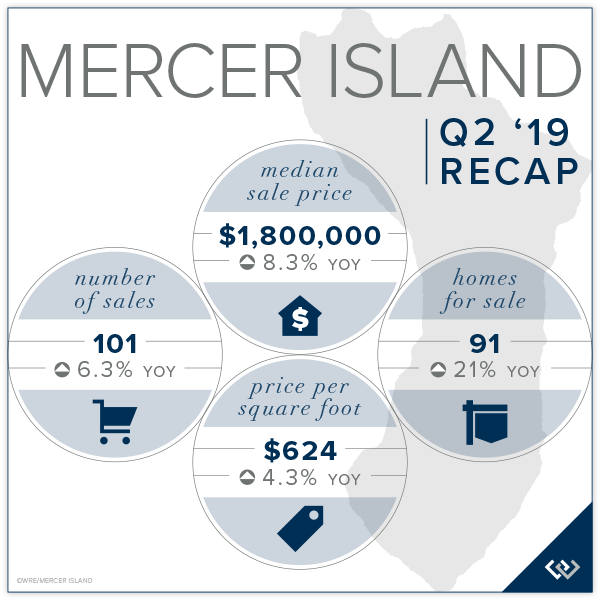
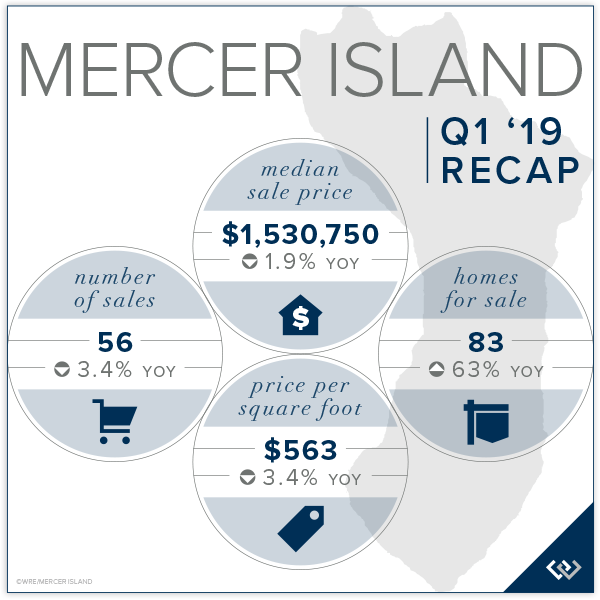
MERCER ISLAND
Mercer Island’s Median Sale Price rallied back up in Q2 to $1.8 million after lower than typical sales drove it down to $1.53 in Q1. Eight waterfront sales contributed to the overall increase, as did the total sales velocity of 101 homes sold in Q2—the highest number of sales than in any of the preceding eight quarters.
Click here to view the complete report for a neighborhood by neighborhood breakdown of Average Sale Price, size, and number of homes sold.

CONDOS – SEATTLE & EASTSIDE
Seattle’s condo Median Sale Price was up 5.1% from Q1 to $483,500, but down 7.9% from a peak of $525,000 in Q2 of 2018. The Average $ Per Square Foot was $580. Condos in West Seattle and Lake Forest Park/Kenmore performed best in Q2.
The Eastside’s condo Median Sale Price was up 4.3% from Q1 to $480,000, but down 2.1% from the $490,500 median of Q2 2018. The Average $ Per Square Foot was $453. West Bellevue and Kirkland Condos performed well above condos in other Eastside markets.
Check out all of these factoids and more in the full condo report.

WATERFRONT
A significant number of private waterfront homes transacted in Q2 2019—fourteen on the Eastside, eight on Mercer Island, and eleven each in Seattle and Lake Sammamish. The highest Q2 sale was a 1998 Yarrow Point home on 115 feet of waterfront sold at $14,250,000 after 22 days on the market. The lowest sale was a 1945 Kennydale area home on 53 feet of Lake Washington waterfront for $1,075,000 on the market for 64 days.
The Eastside and Lake Sammamish both had a very moderate supply of inventory in relation to the number of sales that occurred. Seattle and Mercer Island still had more homes on the market than recent demand has dictated, although the volume of sales in Q2 improved the oversupply of inventory, heating up these markets to their highest levels in some time.
This top-level overview of the entire Seattle-Eastside private waterfront market, including Mercer Island and Lake Sammamish, provides a glance into the trends occurring in our region over time. Interesting, and certainly insightful, it in no way replaces an in-depth analysis on waterfront value provided by a savvy broker with years of local waterfront experience.

ABOUT WINDERMERE MERCER ISLAND
We earn the trust and loyalty of our brokers and clients by doing real estate exceptionally well. The leader in our market, we deliver client-focused service in an authentic, collaborative and transparent manner and with the unmatched knowledge and expertise that comes from decades of experience.
© Copyright 2019, Windermere Real Estate/Mercer Island. Information and statistics derived from Northwest Multiple Listing Service and deemed accurate but not guaranteed.
Q1 2019 Reports: How’s the Market?

Be forewarned, this quarter’s report looks somewhat dismal. There are two very relevant facts that should be taken into consideration when reviewing it. The first is that Q1 is nearly always the worst performing quarter of any year because the sales completed in Q1 typically went under contract between late November and the end of February—a notably quieter time of year in our seasonal Seattle market.
The second aspect to consider is that Q1 of 2018 was an atypically strong quarter and likely marked the peak of the current real estate cycle as buyers approach this year’s spring market with cautious optimism rather than the reckless abandon that we witnessed in the first four months of last year.
Since then, mortgage interest rates rose in November to a seven-year high of 4.87% and then subsequently came down to 4.27% in March—creating enough of a stir to get buyers attention. Each 1% increase in mortgage interest rate is equivalent to a 10% increase in home price. Conversely, a half point drop in the rate is comparable to a 5% price reduction.
Sellers and buyers are beginning the second quarter on more equal footing than they’ve had since the late 1990’s as we’ve rapidly oscillated between a seller’s market, a buyer’s market, and then a seller’s market again with little breathing room in between. Sellers have enjoyed a seven-year run with double digit annual appreciation most of those years. Buyers have enjoyed record setting low interest rates and can purchase today at what amounts to roughly 60% of the monthly expense of the forty-seven-year average 8.09% mortgage interest rate.
The market has much to offer buyers and sellers this year. We believe those looking to make a move in the next few years should do so this year when they can still secure incredibly affordable mortgage financing. Today’s buyers should be prepared to stay in their home at least five years. Home sellers moving to lower cost regions may also benefit from selling now. We know that every situation is unique, and we are here to help you evaluate your personal real estate holdings and purchase strategy.
Click or scroll down to find your area report:
Seattle | Eastside | Mercer Island | Condos | Waterfront
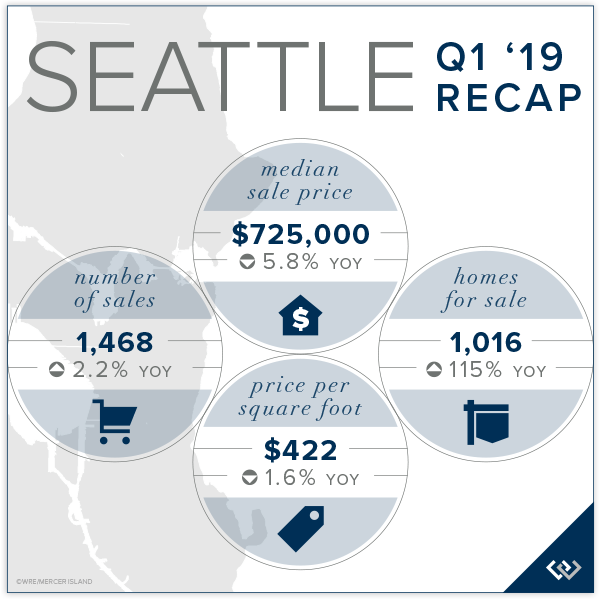
SEATTLE
The number of homes for sale more than doubled in Q1 compared to one year ago giving buyers options and compelling sellers to put their best foot forward. Seattle’s overall Median Sale Price was down 5.8% from Q1 2018 to $725,000 and down 1.4% from Q4. The Average $ Per Square Foot was down 1.6% from Q1 last year to $422. Queen Anne-Magnolia and North Seattle were the most impacted markets with the largest decrease in median price. As disappointing as the numbers are, Seattle homeowners have seen a 60% increase in the Median Sale Price over the past five years.
Click here to view the complete report for a neighborhood by neighborhood breakdown of Average Sale Price, size, and number of homes sold.

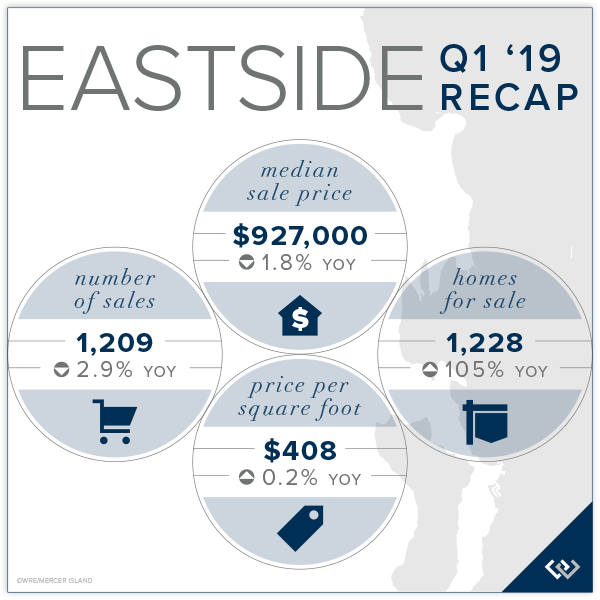
EASTSIDE
Continued employment growth and planned expansion on the Eastside have benefitted homeowners as compared to Seattle as Bellevue, Redmond and Kirkland prepare for unprecedented development in the next decade. The Eastside’s Median Sale Price was down 1.8% from Q1 2018 to $927,000, but up 3.9% from Q4. The five-year Eastside median price trend is up 53% over 2014.
East Bellevue, East of Lake Sammamish, and Woodinville performed best in Q1—all with median price increases rather than reductions. A total of 1,209 home sales closed in Q1, which was down significantly from Q4, but down only slightly from the robust Q1 2018.
Click here for the full report and neighborhood-by-neighborhood statistics!

MERCER ISLAND
Following a 10% Median Sale Price increase in 2018, the Mercer Island median fell 1.9% in Q1 2019 from Q1 2018 and 10.9% from Q4. Fewer luxury sales—only one waterfront sold in Q1—and lower demand contributed to the off quarter. The lower velocity of luxury sales impacted the Average Sale Price even more so than Realistically priced homes in solid condition and with desirable lot amenities and settings will do well in Q2 as they are met with demand from the greatest segment of buyers.
Click here to view the complete report for a neighborhood by neighborhood breakdown of Average Sale Price, size, and number of homes sold.

CONDOS – SEATTLE & EASTSIDE
Affordability and access to transportation and amenities continues to drive condo desirability, but a nearly three-fold increase in the number of units for sale and softening apartment rents have tempered demand in some areas.
Seattle’s Condo Median Sale Price was down 4% from Q4 and 10.7% from Q1 2018 to $460,000 following a 12.8% median price increase in 2018. The Average $ Per Square Foot was $577. West Seattle and Queen Anne condos fared better than average while condos prices to the north softened a bit more.
The Eastside’s Condo Median Sale Price was down 5.5% from Q4 and 4.2% from Q1 2018 to $460,000—the same as Seattle—following a 17.2% median price increase in 2018 and a 20.6% increase in 2017. The Average $ Per Square Foot was $431. South Eastside and Mercer Island condos performed better than average while Kirkland condos struggled in Q1.
Check out all of these factoids and more in the full condo report.

WATERFRONT
The Eastside had more private waterfront activity than Seattle, Mercer Island & Lake Sammamish combined. Seattle and Mercer Island sales were far slower than typical in Q1 with only two sales in Seattle and one sale on Mercer Island reported to NWMLS. Mercer Island had eight Q1 sales in 2017 and five in 2018. Seattle had six Q1 sales in 2017 and 3 in 2018.
The highest Q1 sale was a 1963 Yarrow Point home on 80 feet of waterfront sold at $8,650,000 after only 5 days on the market. The lowest sale was a 1940 Pleasure Point bungalow in South Bellevue with 45 feet of waterfront for $1,560,000 on the market for 7 days. Waterfront homes sold in Q1 tended to either sell immediately or languish on the market for months with very few finding middle ground.
This top-level overview of the entire Seattle-Eastside private waterfront market, including Mercer Island and Lake Sammamish, provides a glance into the trends occurring in our region over time. Interesting, and certainly insightful, it in no way replaces an in-depth analysis on waterfront value provided by a savvy broker with years of local waterfront experience.
Check out the full Waterfront Report for a complete list of waterfront home sales by address and community.

ABOUT WINDERMERE MERCER ISLAND
We earn the trust and loyalty of our brokers and clients by doing real estate exceptionally well. The leader in our market, we deliver client-focused service in an authentic, collaborative and transparent manner and with the unmatched knowledge and expertise that comes from decades of experience.
© Copyright 2019, Windermere Real Estate/Mercer Island. Information and statistics derived from Northwest Multiple Listing Service and deemed accurate but not guaranteed.
Annual Seattle-Eastside Real Estate Report: A Look Back at 2018


An increase in homes for sale coupled with rising interest rates have created a far more balanced market than we started 2018 with. This is a good thing as it will help our region tame affordability and create a sustainable marketplace. More homes came to market in 2018 than in any year since 2011. This provided home buyers with plentiful choices and forced home sellers to competitively position their homes to compete with other homes for sale—something they haven’t had to give much thought to in the last seven years.
The cost of a 30-year fixed-rate mortgage began the year at 3.95% and ended at 4.64%. Indications show rates could rise to 6% by the end of 2019. Mortgage rates are a far bigger factor than most people consider. A 1% increase in mortgage interest rates decreases buying power by 10%. Or said differently, a 1% rate increase has the same net effect on monthly payment as a 10% increase in the sale price. That also means if prices fell 10% but rates went up 1% the monthly mortgage payment would remain the same.
Our 2019 market will be driven by buyers motivated to beat interest rate hikes nipping at their heels and by sellers who will choose to price moderately following a seven-year appreciation growth run. Properly-priced homes in good condition and in desirable settings will do well, as will affordable homes on the periphery of the metro region. Strategic positioning, savvy marketing, and expert negotiation have never been so important as they are now.
Click or scroll down to find your area report:
Seattle | Eastside | Mercer Island | Condos | Waterfront
SEATTLE
2018 was a year of transition from an ultra-competitive seller’s market to a more balanced market. The first four months of the year saw dramatic price acceleration—arguably far beyond the comfort of Seattle area home buyers—as home values skyrocketed each month through the spring market. Around the beginning of May, home buying activity slowed as the number of homes for sale increased and buyers had more choices for the first time in years. Home prices have declined since that peak in most neighborhoods, but still ended the year up comfortably over 2017 values.
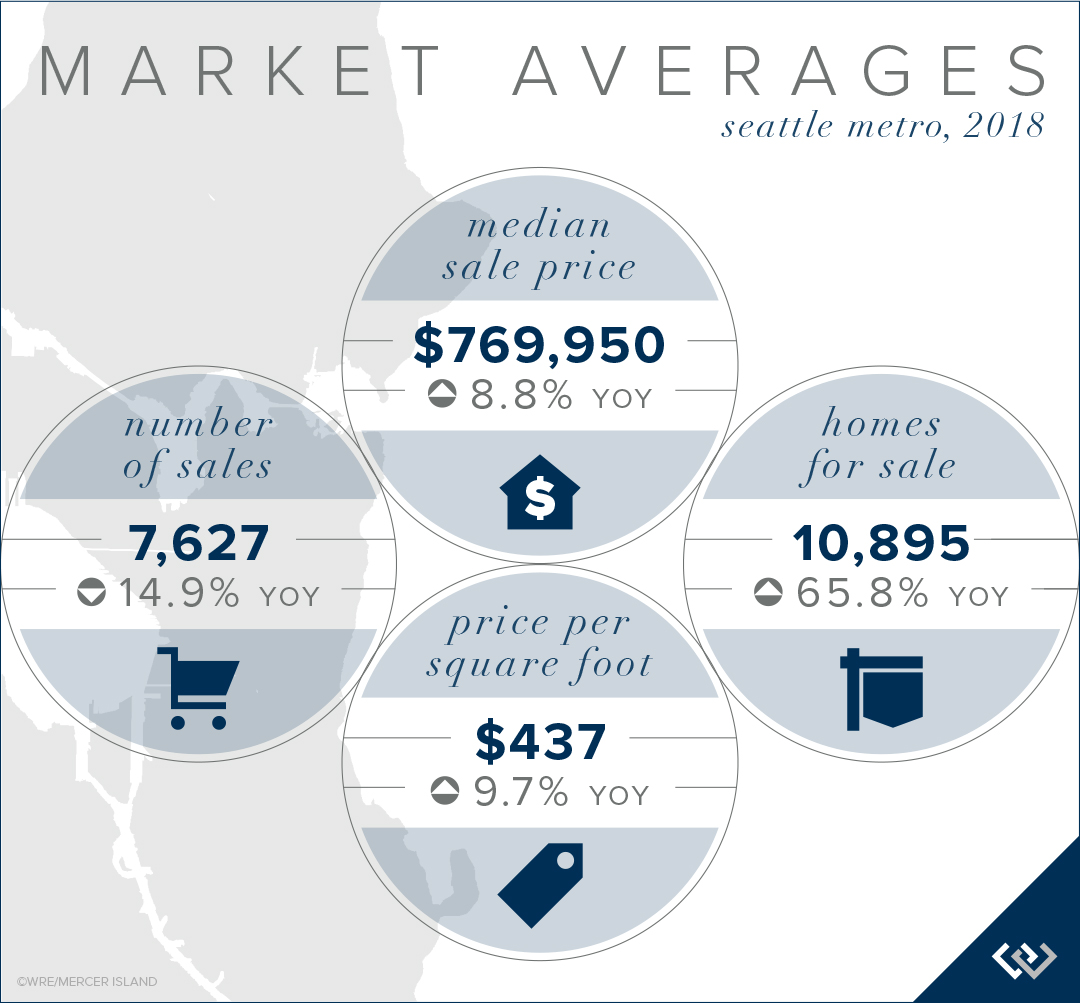
Seattle’s overall Median Sale Price was up 8.8% to $769,950, while its Average Sale Price was up 10.4% to $883,590. The Average $ Per Square Foot increased 9.7% to $437, with Lake Forest Park/Kenmore the most affordable region at $327/sq ft and Madison Park/Capitol Hill the most spendy at $561/sq ft.
Three Seattle neighborhoods had double-digit median price growth in 2018: Lake Forest Park/Kenmore at 14.4%, West Seattle at 12.7%, and Queen Anne/Magnolia at 12.2%.

Click here to view the complete report for a neighborhood by neighborhood breakdown of Average Sale Price, size, and number of homes sold.

EASTSIDE
Even with Eastside expansion announcements from several notable tech companies, 2018 saw a shift from an ultra-competitive seller’s market to a more balanced market. While the sky is not falling, price growth has slowed to a more modest and sustainable pace. After rising astronomically at the beginning of the year, prices have generally softened as buyers and sellers find their new norms.
The Eastside’s overall Median Sale Price was up 8.2% to $939,129, while its Average Sale Price was up 9.3% to $1,143,557. The higher average sale price reflects the impact of luxury home prices at the upper end of the market. The median sale price is attributed to the larger volume of mainstream sales at more moderate price points.
Four Eastside neighborhoods had double-digit median price growth in 2018: Kirkland at 23.8%, Woodinville at 12.9%, West Bellevue at 12.4%, and Mercer Island at 10.0%.

Click here for the full report and neighborhood-by-neighborhood statistics!

MERCER ISLAND
The Island, much like the region surrounding it, saw a shift from an ultra-competitive seller’s market to a more balanced market as the number of homes for sale increased markedly following a strong spring market. Home values have softened since the peak market of 2018, but still ended the year with a hefty increase over 2017 values.
The number of home sales were down in 2018: 285, as compared to 330 in 2017. Modern, turn-key homes and highly desirable settings were most sought after while those lacking essential attributes were often passed over, ending the year unsold.
Uniquely situated near both the Seattle and Eastside metro areas, the Island has always tended to fare better than most in a transitioning market. Mercer Island’s Median Sale Price was up 10.0% to $1,700,000, while its Average Sale Price was up 10.5% to $2,059,996. The higher average sale price reflects the impact of luxury home prices at the upper end of the market. The Average $ Per Square Foot increased 11.3% to $606.

Click here to view the complete report for a neighborhood by neighborhood breakdown of Average Sale Price, size, and number of homes sold.

CONDOS – SEATTLE & EASTSIDE
New construction added to the more than two-fold increase in the number of condos for sale during the year compared to 2017, from 2,131 to 4,857 units listed throughout the year. Even so, regional affordability issues drove condo desirability to all-time highs and fueled price increases that outpaced single-family homes.
Seattle’s Condo Median Sale Price was up 12.8% to $505,500, while its Average Sale Price was up 10.5% to $582,163. The Average $ Per Square Foot increased 7.5% to $601. Three regions saw increases above 20%: Richmond Beach/Shoreline at 26.8%, Ballard/Green Lake at 24.1%, and South Seattle at 24.0%.
The Eastside’s Condo Median Sale Price was up 17.2% to $480,500, while its Average Sale Price was up 17.0% to $576,061. The Average $ Per Square Foot increased 13.5% to $453. Two regions saw increases above 20%: East Bellevue at 34.0% and Kirkland at 25.0%.
Check out all of these factoids and more in the full condo report.

WATERFRONT
While the number of sales in 2018 was down markedly compared to recent years as a result of fewer international buyer purchases, a handful of notable sales drove value markers up, creating the artificial appearance of appreciation when price growth was relatively flat in 2018. Those sales include three Media and Points properties sold above $14 M, a record Lake Sammamish sale above $11 M, a Mercer Island sale above $13 M, and a Laurelhurst sale at $11 M.
This top-level overview of the entire Seattle-Eastside private waterfront market, including Mercer Island and Lake Sammamish, provides a glance into the trends occurring in our region over time. Interesting, and certainly insightful, it in no way replaces an in-depth analysis on waterfront value provided by a savvy broker with years of local waterfront experience.
Check out the full Waterfront Report for a complete list of waterfront home sales by address and community.

ABOUT WINDERMERE MERCER ISLAND
We earn the trust and loyalty of our brokers and clients by doing real estate exceptionally well. The leader in our market, we deliver client-focused service in an authentic, collaborative and transparent manner and with the unmatched knowledge and expertise that comes from decades of experience.
© Copyright 2019, Windermere Real Estate/Mercer Island. Information and statistics derived from Northwest Multiple Listing Service and deemed accurate but not guaranteed.
Give Back This Season


Looking to share your bounty this holiday season? Below are some of my favorite Seattle-area organizations who can use your time, household items, toys, and more to help improve the lives of homeless and low-income families in our area. You might also check out these tips on how to make the most of charitable giving.
![]()
Northwest Harvest’s mission is to end hunger in Washington. They partner with 375 food pantries, meal programs, and high-need schools across the state to provide nutritious food and promote good health for those in need. You can help by volunteering at the Cherry Street Food Bank in Seattle (children in 3rd grade or older are welcome to volunteer with you!). You can also host a virtual food drive or make a cash/vehicle donation.
http://www.northwestharvest.org/
1 (800) 722-6924
Cherry Street Food Bank: 711 Cherry Street, Seattle
Kent Warehouse: 22220 68th Ave S, Kent

Mary’s Place helps homeless women, children and families from the greater King County area. With a list of families that has double this year, the need for help is higher than ever. You or your organization might consider supporting their giving tree (donations due by December 7th) or joining in the Brooks Holiday Fun Run on December 1st benefiting the No Child Sleeps Outside campaign. You can also volunteer your time, donate wishlist items, or share your used clothing, blankets, and coats.
http://www.marysplaceseattle.org
(206) 621-8474
Donation Center in SODO: 9 South Nevada St, Seattle
Family Center in North Seattle: 1155 N 130th St, Seattle
![]()
Hopelink provides critical services to homeless and low-income families, children, seniors, and people with disabilities on north and east King County. You can help by donating food or grocery gift cards to their food bank, contributing unwrapped toys to their holiday gift room, or volunteering to help with their holiday giving events.
https://www.hopelink.org/
(425) 869-6000
8990 154th Ave NE, Redmond

Each night in Seattle, 700-1,000 young people are homeless and most were traumatized before they reached the streets. YouthCare builds confidence and self-sufficiency for homeless youth by providing a continuum of care that includes outreach, basic services, emergency shelter, housing, counseling, education, and employment training. Lend a hand by volunteering, hosting a drive, or hiring a YouthCare graduate.
http://youthcare.org/
(206) 694-4500
2500 NE 54th Street, Seattle

Did you know less than 50% of Washington state youth in foster care graduate from high school? Treehouse seeks to level the playing field by providing academic and other essential support foster kids need to graduate at the same rate as their peers, with a plan for their future. You can help by volunteering, hosting a drive or donating to their holiday program.
https://www.treehouseforkids.org/
(206) 767-7000
2100 24th Avenue S./Suite 200

With a mission to help people in need of immediate food assistance, the Emergency Feeding Program partners with 240 local agencies to distribute 50,000 bags of quality, nutritional food and ensure that no one will go hungry tonight. You can help by donating these most needed foods or making a cash contribution.
https://www.emergencyfeeding.org/
(425) 277-0300
851 Houser Way N, Renton
![]()
Eastside Baby Corner was founded by a local pediatric nurse concerned about the large numbers of babies in her practice who began life without basic essentials like adequate food, clothing, beds, or safety equipment. Today Eastside Baby Corner’s location in Issaquah, Northshore and Bremerton collect, purchase, and distribute essential care items such as formula, diapers, carseats, warm coats, school supplies, and more for babies and children in need. You can help out by volunteering, donating, or organizing a drive.
Eastside Baby Corner:
http://babycorner.org
(425) 865-0234
1510 NW Maple St. in Issaquah
6524 NE 181st Street, Suite 6, Kenmore1463 NE Dawn Road, Suite B, Bremerton
![]()
Since 1947, The U.S. Marine Corps Toys for Tots program has distributed 548 million toys to 251 million children in need. Consider helping out this year by donating a new toy, volunteering, or asking your organization to become a toy drop site.
https://fort-lewis-wa.toysfortots.org
Click Here for Toy Drop Off Locations
Coordinator: Gunnery Sergeant James Wells, (253) 720-9858

Every year, nearly 40% of our country’s food ends up in landfills, while millions go hungry. Food Lifeline attempts to solve both problems by rescuing millions of pounds of surplus food from farmers, manufacturers, grocery stores, and restaurants. They then deliver this healthy and nutritious food to more than 300 food banks, shelters and meal programs across Western Washington–providing 97,000 meals every day. You can help by volunteering (opportunities are available for kids as young as 6, too!), donating funds or hosting a food drive.
https://foodlifeline.org/
(206) 545-6600
815 S 96th St, Seattle

Wellspring helps low-income and vulnerable individuals, children and families in Seattle and King County address issues such as mental health, family homelessness, early learning, basic needs, and domestic violence intervention. Each year they help thousands of children and families break cycles of instability, homelessness, and adversity to achieve positive, permanent change. You can help by donating to their Giving Together holiday campaign or getting your children involved in the Kids Helping Kids youth philanthropy program.
http://wellspringfs.org/
(206) 826-3050
1900 Rainier Avenue South, Seattle
![]()
Founded and run by a group of philanthropic women over 100 years ago, Seattle Children’s mission is to provide hope, care and cures to help every child live the healthiest and most fulfilling life possible. You can help their patients by donating a new toy or gift card, volunteering, contributing funds, or supporting one of its guilds (such as the Project Kids Cancer Cure Guild).
http://www.seattlechildrens.org
(206) 987-2000
4800 Sand Point Way NE, Seattle
ABOUT WINDERMERE MERCER ISLAND
We earn the trust and loyalty of our brokers and clients by doing real estate exceptionally well. The leader in our market, we deliver client-focused service in an authentic, collaborative and transparent manner and with the unmatched knowledge and expertise that comes from decades of experience.
© Copyright 2018, Windermere Real Estate/Mercer Island.
2018 Holiday Happenings in the Seattle Area


Our Northwest holidays may be wet, but they’re still bright! Make the most of the season with Seattle favorites—such as dazzling light displays and the Parade of Boats—along with new additions like the “Enchant” event with light mazes and ice skating inside Safeco field. Scroll down for all the details…
WildLights at Woodland Park Zoo
5500 Phinney Ave. N, Seattle, WA 98103
www.zoo.org/zoolights
click here to get tickets
- Dates/Times: Open nightly 11/23/18 – 1/5/19 | 5:30 – 8:30 pm
- Cost: $9.95 – $14.95 per person (ages 2 and under are free)
- Promotion: Get a 10% group discount on WildLights tickets for groups of 20+ (12/14/18 – 1/5/19).
- Parking: Free parking is available at all lots after 4:30 pm (admission at both gates)
- Food: Refreshments are available at food kiosks, Pizza Corner, and at the Pacific Blue Chowder House (with covered seating provided). You are also welcome to bring your own food and non-alcoholic beverages.
- Special activities: Carousel, fire pits, select indoor animal exhibits, ZooStore, & indoor snowball fights at the Snowmazium
- Closures: December 12, 24 & 25, 2018
Image courtesy of https://zoo.org/zoolights
Winterfest at Seattle Center
305 Harrison Street, Seattle, WA 98109
www.seattlecenter.com/winterfest
Map
- Dates/Times: Winter train & village open daily 11/23/18 – 12/31/18 | 10 am – 6 pm
Winterfest Ice Rink open 11/23/18 – 1/6/19, Sun-Thu from 11 am – 8 pm, Fri-Sat from 11 am – 10 pm - Cost: Free for all ages (ice skating is $2 – $8 including rental)
- Parking: Paid parking available at the Mercer Garage, 1st Ave N Garage, 5th Ave N Garage, and Theatre Commons Lot. Click here for the campus map
- Food: A multitude of dining options await you in the Armory
- Special events: Ice skating at the Winterfest Ice Rink, ice sculpting, caroling, the Winter Train & Village, and more!
- Holiday Closure: 12/25
Enchant at Safeco Field
1250 1st Ave S, Seattle, WA 98134
https://enchantchristmas.com/seattle/
click here to get tickets
- Dates/Times: 11/23/18 – 12/30/18 | Sun-Thu from 4 – 10 pm, Fri-Sat from 4 – 11 pm
- Cost: $19 – $32.99 per person (ages 3 and under are free) | VIP passes with dinner starting at $64.99
- Promotions: Discount days on 11/27, 12/4 & 12/11 | Discount on final 2 hours of any day | Group discounts for 15 or more
- Parking: $8 – $60 at Safeco Field Garages or check out the city’s Interactive Parking Map
- Food: Seasonal food and treat concessions throughout
- Activities: Ice skating trail, light maze, visits with Santa & Mrs. Claus, nightly live music & shows, gift market
- Closures: 11/26, 12/3 & 12/10

Garden d’Lights at Bellevue Botanical Garden
12001 Main Street, Bellevue WA 98005
https://bellevuebotanical.org/garden-dlights/
click here to get tickets
- Dates/Times: Open nightly 11/24/18 – 12/30/18 | 4:30 – 9:00 pm
- Cost: $5 per person (ages 10 and under are free)
- Promotion: Free admission nights on November 24, 25, 26, 27, 28 & 29
- Parking: Premium parking is $5 per car in the Garden’s lot (cash only) as space allows OR park for free at Wilburton Hill Park
- Food: Hot drinks and snacks are available at the Aaron Education Center
- Activities: Gingerbread village, live music
- Holiday Closures: None
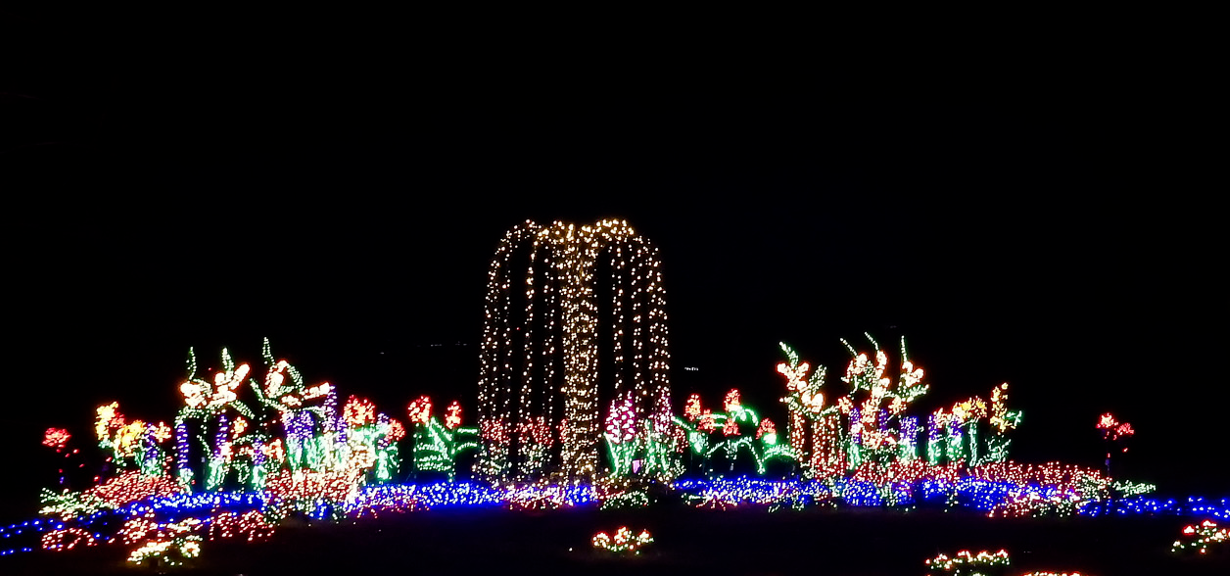
Image courtesy of https://gardendlights.org/
Snowflake Lane at the Bellevue Collection
Bellevue Way & NE 8th Street, Bellevue WA 98004
http://snowflakelane.com/
- Dates/Times: Nightly 11/23/18 – 12/24/18 | 20 minute show starts at 7 pm
- Cost: Free for all ages
- Parking: Free parking at Bellevue Square, Bellevue Place and Lincoln Square
- Food: A variety of dining options (from happy hour, to kid fare, to gourmet meal) are all within walking distance
- Special Events & Activities: Ice Skating, Santa Parade & Tree Lighting, Santa Photos
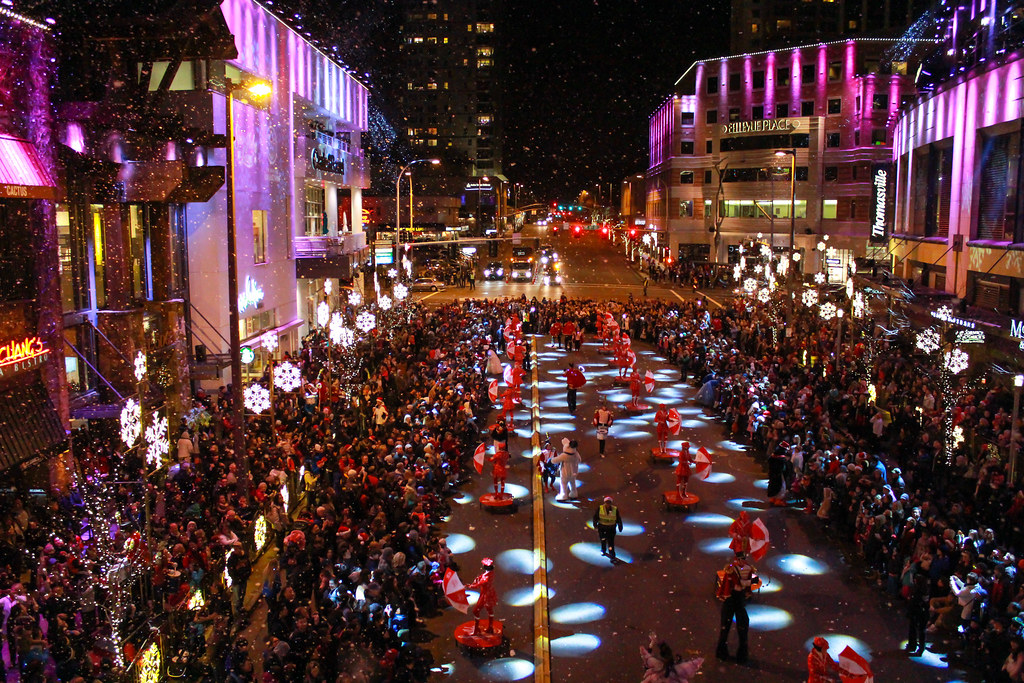
Image courtesy of http://bellevue.com/snowflake-lane
Christmas Ship Festival
Launch locations include Lake Union Park, Kirkland City Dock, Hyatt Regency Lake Washington, Des Moines Marina, Port of Poulsbo, Seattle Waterfront – Pier 55, Tacoma (Dock Street Marina), Edmonds, and Shilshole Bay Marina
www.argosycruises.com
click here to get tickets
- Dates/Times: Click here for the full schedule
- Cost: $22 – $68 per person (kids 3 and under are free)
- Parking: Varies by location – click here for details
- Food: While dining ahead of time is recommended, there are snacks and drinks available for purchase on the ship. You can also pre-order Ingallina’s boxed meals (with vegetarian and gluten-free options) at least 72 hours prior to your cruise. Outside food/drinks are not allowed.
- Special Events: Parade of Boats Night, Kid Cruise, Grand Finale Night

Ivar’s Clam Lights at Gene Coulon Memorial Beach Park
1201 Lake Washington Blvd N, Renton, WA 98056
https://rentonwa.gov/clamlights
- Dates/Times: Open nightly 11/30/18 – 1/1/19 | 5 – 9 pm
- Cost: Free for all ages
- Parking: Park for free at the Gene Coulon Memorial Beach Park parking lot
- Kickoff Event on November 30th, 2018, 5:30-8:30: Music, selfie-station with Santa & Mrs. Claus in their sleigh, official lighting ceremony, Parade of Boats viewing, and a visit from the Christmas Ship and Dickens Carolers
- Holiday Closures: None

Image courtesy of https://rentonwa.gov/clamlights
Westlake Center Tree Lighting & Holiday Activities
400 Pine St., Seattle, WA 98101 (Westlake Park)
http://redtri.com/seattle/westlake-center-tree-lighting/
- Dates/Times: Tree lighting ceremony on 11/23/18 at 4:30 pm. Holiday market Fri-Sun beginning 11/23 through 12/23. Carousel and other festive attractions through January 1st, 2019
- Cost: Free for all ages
- Parking: Access the Republic Parking garage from Olive Way between 4th & 5th Ave, or check out this interactive map of city parking
- Activities: Carousel, Holiday Market at Westlake Park
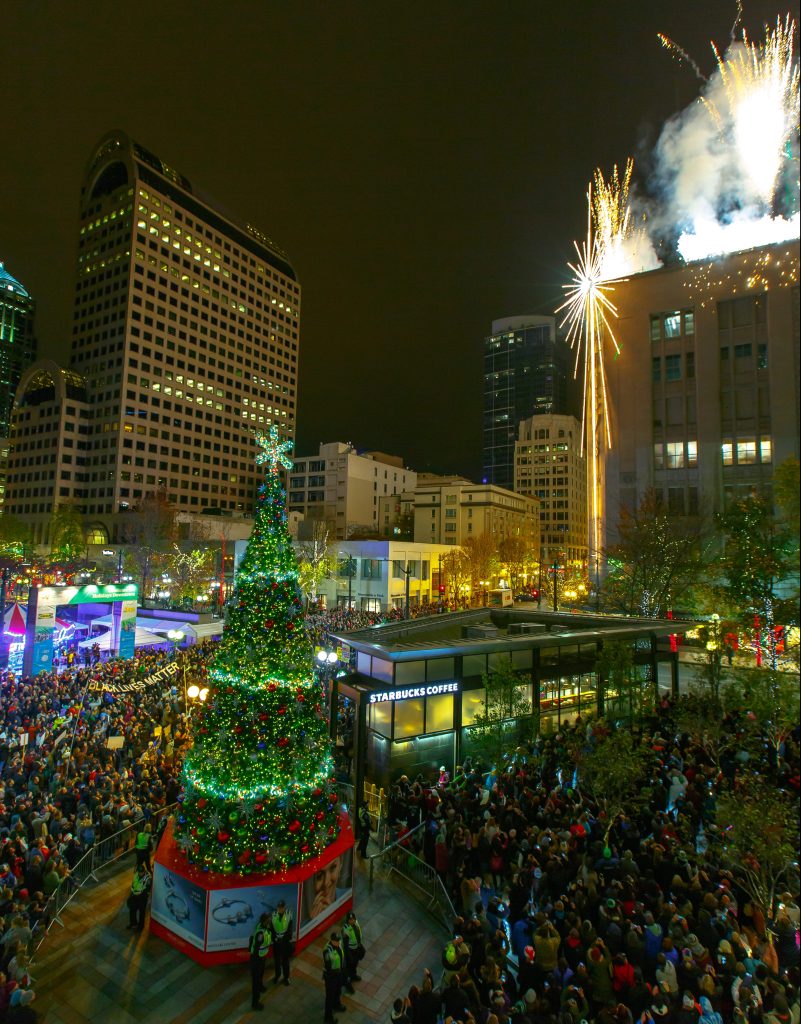
Image courtesy of http://redtri.com
Zoolights at Point Defiance Zoo & Aquarium
5400 N Pearl St, Tacoma, WA 98407
www.pdza.org/event/zoolights
click here to get tickets
- Dates/Times: Open nightly 11/23/2018 – 1/6/2019 | 5 – 9 pm
- Cost: $10-$12 (free for kids 2 & under)
- Promotions: $6 for zoo members; Scout discount night 12/4; Military discount nights Nov. 26, 28 & Dec. 3, 5, 10, 12, 17, & 19
- Parking: Free parking in zoo lots (carpooling recommended)
- Food: Warm drinks & treats available at the cafe and kiosks
- Activities: Camel rides, carousel, aquarium, Kids’ Zone with animals
- Holiday Closure: 12/24
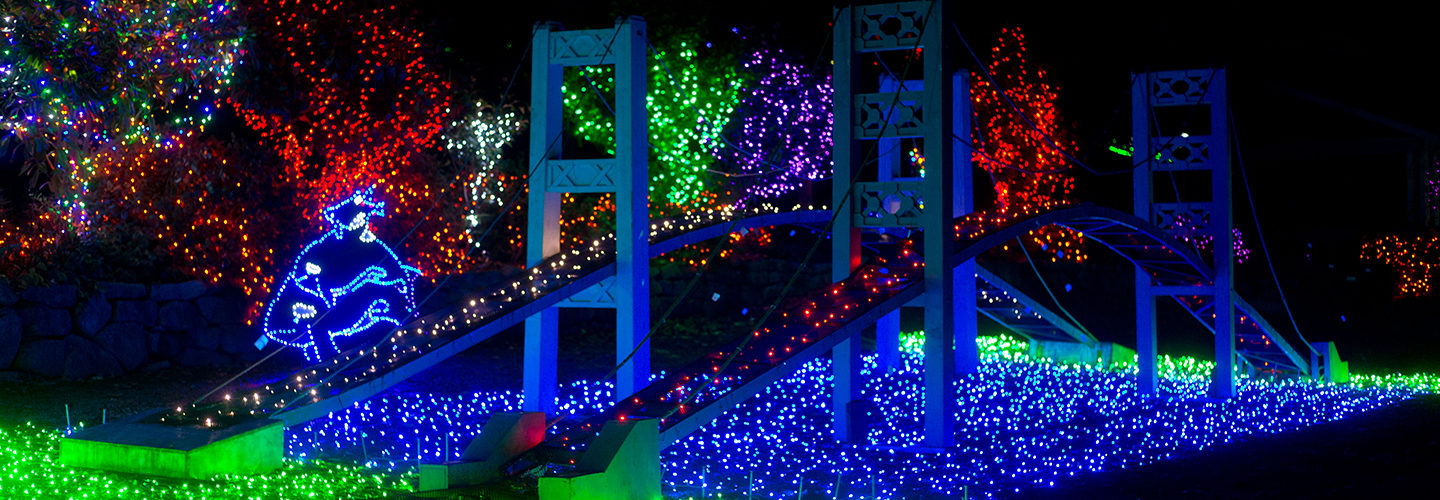
Image courtesy of https://www.pdza.org
ABOUT WINDERMERE MERCER ISLAND
We earn the trust and loyalty of our brokers and clients by doing real estate exceptionally well. The leader in our market, we deliver client-focused service in an authentic, collaborative and transparent manner and with the unmatched knowledge and expertise that comes from decades of experience.
© Copyright 2018, Windermere Real Estate/Mercer Island.
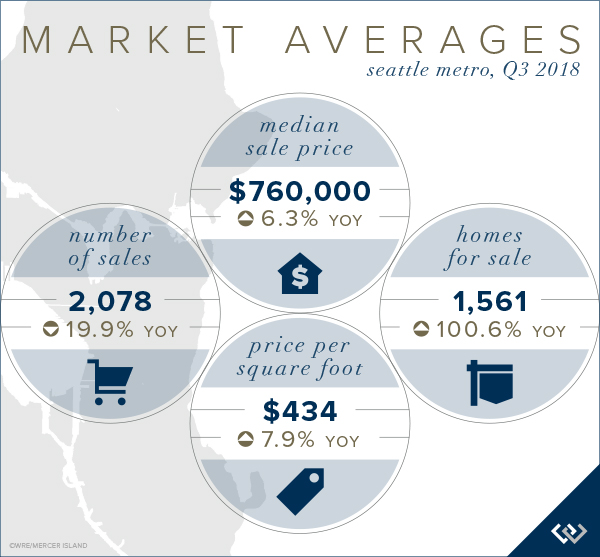
Q3 2018 Seattle-Eastside Real Estate Report

As Q3 comes to a close, 30-year fixed-rate mortgages are at their highest levels since April 2011—now averaging just above 4.7%. Even so, they are still far lower than their 30-year trendline. A 1% increase in mortgage interest rates decreases buying power by 10%. Or said differently, a 1% rate increase has the same net effect on monthly payment as a 10% increase in the sale price. That also means if prices fell 10% but rates went up 1% your payment would remain the same. This is a far bigger factor than most people consider.
Both first-time and move-up home buyers, with (finally!) more homes for sale to choose from and motivated by anticipated further rate hikes nipping at their heels, will feel the urgency to get moved and settled while they can still afford to do so.
Our market is likely to increasingly favor buyers as interest rates cause mortgage payments to increase uncomfortably beyond the affordability ceiling governed by personal income and wages. Properly-priced turn-key homes, and those in the most desirable settings, are still commanding very attractive prices and occasionally multiple offers. Everything else is seeing slowing appreciation and market softening. Strategic positioning, savvy marketing, and expert negotiation have never been so important as they are now.
Click or scroll down to find your area report:
Seattle | Eastside | Mercer Island | Condos | Waterfront
SEATTLE
Seattle neighborhoods that were strongly bolstered by new construction and renovation saw the strongest sales activity, and not surprisingly, the greatest correlated price growth. Up 16.4% Q3 over Q3, the Queen Anne/Magnolia area led the charge, followed closely by Madison Park/Capitol Hill at 15.9%. Lake Forest Park/Kenmore at 13.2% and West Seattle at 12.5% also fared very well. Richmond Beach/Shoreline (6.2%), Ballard/Green Lake (4%), North Seattle (3.4%), and South Seattle (0.7%) saw notable price easing and contributed to rounding Seattle out to a modest 6.3% overall Q3 2017 to Q3 2018 median price increase.

Click here to view the complete report for a neighborhood by neighborhood breakdown of Average Sale Price, size, and number of homes sold.

EASTSIDE
Sharp increases in the number of homes for sale coupled with fewer international buyer transactions has caused a few ripples in the Eastside real estate market.
Mercer Island shows the strongest Q3 over Q3 increase in median sale price (see explanation below) at 19.7%, followed by Woodinville at 12.3% and Redmond at 12.2%. Bringing up the mid-section was West Bellevue at 8.0%, East of Lake Sammamish at 7.8%. Lagging the Eastside median increase of 7.3% were Kirkland (6.9%), South Eastside (2.0%), and East Bellevue (1.8%).

Click here for the full report and neighborhood-by-neighborhood statistics!

MERCER ISLAND
The Q3 median sale price was 19.7% higher than that of Q3 2017. However, its crucial to note that Q3 of 2017 was an anomaly with many land-value sales transacting at the low end of the price spectrum. The effect was that the median sale price was 10.2% lower than Q1 of that same year. Far fewer moderately priced homes transacted in Q3 of this year.
There were 89 sales in Q3 2017 and of those sales 45 were of homes priced below $1.5 million. Compare that to Q3 of 2018 with 74 sales, of which only 28 were priced below $1.5 million. The differential of sales between the two years was almost entirely composed of entry-level and land value home sales.
To further prove this, we looked at comparable homes sold this year and last (an approach like that of the Case-Schiller index). All things being roughly equal, the median sale price of that subset of homes increased only 9.0% from Q3 2017 to Q3 2018. This number is far more in alignment with what we have truly experienced in our market.

Click here to view the complete report for a neighborhood by neighborhood breakdown of Average Sale Price, size, and number of homes sold.

CONDOS – SEATTLE & EASTSIDE
Significant new construction projects underway or announced have dampened sales of existing condos somewhat, especially where they will directly compete with the new buildings. Neighborhood safety is being weighted more carefully against urban hip now more than ever. In Seattle, median sale prices of existing condos in Downtown Seattle/Belltown (-0.4%), Queen Anne/Magnolia (-4.8%), and North Seattle (-8.0%) have all decreased while surrounding areas have seen very strong to moderate Q3-Q3 increases. This quarter’s top contenders were Richmond Beach-Shoreline (30.3%), Ballard-Green Lake (26%), and West Seattle (25%).
On the Eastside, all areas except South Bellevue (-9.3%) saw considerable increases in the Q3 median sale price. East Bellevue (37.1%), Redmond (19.1%), and Kirkland (17.6%) topped the charts.
Check out all of these factoids and more in the full condo report.

WATERFRONT
The Eastside has been a hotbed of waterfront closed sale activity with as many Q3 sales as Seattle, Mercer Island, and Lake Sammamish combined. The number of active private waterfront listings for sale on the Eastside is down compared to Q3 of both 2015 and 2016, while the listing levels of Seattle, Mercer Island and Lake Sammamish waterfront properties remain about the same.
With only two closed sales in Q3, Months of Inventory—the number of homes for sale divided by the number of homes that sold—climbed dramatically on Mercer Island. Seattle, with four closed waterfront sales, saw a similar but more moderate increase. The Eastside and Lake Sammamish both experienced improvement in the Months of Inventory indicator.
The highest private waterfront Q3 sale was of a newer 6,570 square foot Hunts Point modern estate designed by Baylis Architects with 80 feet of no-bank waterfront on just over an acre of lush, private grounds for $18 million. The lowest sale was a 1,010 square feet westside Lake Sammamish 1958 beach house with 60 feet of waterfront on a shy ¼ acre lot with permitted approval for a new 5000 square foot home.
Check out the full Waterfront Report for a complete list of waterfront home sales by address and community.

ABOUT WINDERMERE MERCER ISLAND
We earn the trust and loyalty of our brokers and clients by doing real estate exceptionally well. The leader in our market, we deliver client-focused service in an authentic, collaborative and transparent manner and with the unmatched knowledge and expertise that comes from decades of experience.
© Copyright 2018, Windermere Real Estate/Mercer Island. Information and statistics derived from Northwest Multiple Listing Service and deemed accurate but not guaranteed.
Puget Sound Pumpkin Patches


Grab your boots, pack a thermos…it’s time to choose those perfect Halloween pumpkins! This year, why not explore a new town and make your pumpkin patch experience a true adventure? All of these farms are open every weekend in October, and most are open on weekdays too. Check out their websites to find the most current hours.
EASTSIDE
Fall City Farms
Pumpkins, cider, mini doughnuts, wagon rides & farm animals.
3636 Neal Road | Fall City, WA
(425) 222-4553
fallcityfarms.com/pumpkins
Fox Hollow Farm
Hay maze, Haunted Forest, bounce inflatables, farm animals, s’more roasting…and espresso!
12031 Issaquah-Hobart Rd. SE | Issaquah
(425) 996-0575
foxhollowfamilyfarm.com
Jubilee Farm
Hay rides, pumpkin trebuchet, food trucks, music, hay maze & hand-crank cider press.
229 W Snoqualmie River Rd NE | Carnation
(425) 222-4558
jubileefarm.org
Oxbow Farm
Kids’ farm tours, hay rides, arts & crafts, climbing tractor, house of hay & pumpkin slingshot.
10819 Carnation-Duvall Rd. NE | Carnation
(425) 788-1134
oxbow.org/oxtober
Remlinger Farms
25 rides & attractions (including a mini roller coaster!), hay rides, pony rides & farm faire.
32610 NE 32nd Street | Carnation, WA
(425) 451-8740
remlingerfarms.com
Two Brothers Pumpkin Patch at Game Haven Greenery
Baby calves and an eerie number of well-attired scarecrows.
7110 310th Avenue NE | Carnation, WA
(425) 333-4313
facebook.com/twobrotherspumpkins
NORTH OF SEATTLE
Bailey Vegetables
Play barn, wagon rides, kettle corn, and oodles of fresh produce.
12711 Springhetti Rd | Snohomish
(360) 568-8826
baileyveg.com
Bob’s Corn & Pumpkin Farm
10-acre corn maze, kids’ maze, play area, big slides & apple cannon.
10917 Elliott Road | Snohomish
(360) 668-2506
bobscorn.com
Carleton Farm
Pumpkin cannon, zip line, hay mountain, kids’ corn maze & giant pumpkin jump pad.
630 Sunnyside Blvd SE | Lake Stevens, WA
(425) 334-2297
carletonfarm.com
Craven Farm
Corn mazes, farm animals, miniature golf, hay rides, espresso (!) & face painting.
13817 Short School Road | Snohomish
(360) 568-2601
cravenfarm.com/fall-festival
Fairbank Animal & Pumpkin Farm
Tiny Tot “maize maze,” hay tunnel, veggie garden & flocks of farm animals.
15308 52nd Ave W | Edmonds
(425) 743-3694
fairbankfarm.com
Stocker Farms
Country Market: 10622 Airport Way | Snohomish
7-Acre Corn Maze & Pumpkin Events: 8705 Marsh Rd | Snohomish
(360) 568-7391
stockerfarms.com
The Farm at Swan’s Trail in Snohomish
Corn maze, petting farm, wagon rides, u-pick apple orchard & live duck races.
7301 Rivershore Rd | Snohomish
(425) 334-4124
thefarm1.com
SOUTH OF SEATTLE
Carpinito Brothers Corn Maze & Pumpkin Patch
Rubber duck derby, hay rides, hay slides, kettle corn & corn maze
6868 S. 277th St | Kent
(253) 854-5692
carpinito.com
Maris Farms
Racing pigs & ducks, corn maze, plus the creepy “Haunted Woods” complete with zombies and homicidal maniacs.
25001 Sumner-Buckley Highway | Buckley
(253) 377-3574
marisfarms.com
Mosby Farms
Corn maze, hay rides and fresh farm market.
12754 SE Green Valley Road | Auburn
(253) 405-0711
mosbyfarm.com/pumpkin-patch
Scholz Farm and Garden
Farm animals, corn maze, fresh veggies & preserves.
14310 128th Street E | Puyallup
(253) 848-7604
pugetsoundfresh.org/farm/scholz-farm-and-garden
Spooner Farms
Corn maze, pumpkin sling shot, farm animals, face painting, caramel apples & roasted corn.
9710 State Route 162 East | Puyallup
(253) 840-2059
spoonerberries.com
Thomasson Family Farm
Laser tag, corn box, hay barn, petting farm, slides, duck races, wagon rides & tricycle track
38223 236th Avenue SE | Enumclaw
(360) 802-0503
thomassonfarm.com
ABOUT WINDERMERE MERCER ISLAND
We earn the trust and loyalty of our brokers and clients by doing real estate exceptionally well. The leader in our market, we deliver client-focused service in an authentic, collaborative and transparent manner and with the unmatched knowledge and expertise that comes from decades of experience.
windermeremercerisland.com | (206) 232-0446 | mercerisland@windermere.com
2737 77th Ave SE, Mercer Island, WA 98040.
© Copyright 2018, Windermere Real Estate/Mercer Island.
Kicks for Kids Shoe Drive Now Through August 15th


WHAT: Windermere’s Kicks for Kids event is a back-to-school sneaker drive for low-income youth, distributed through the Eastside Baby Corner.
WHY: Kids from struggling families are in need of back-to-school shoes that fit. When kids feel good about their appearance, it improves both their self-esteem and their performance in school.
WHEN: Formal shoe collection will take place from August 1st – August 15.
WHERE: Windermere Mercer Island is the collection point where you can drop off new athletic shoes or sneakers (youth sizes 1-6 and adult sizes 7-9) or $20 Payless Shoe Source gift cards.
WHO: Sponsored by Windermere Mercer Island in partnership with the Eastside Baby Corner, located in Issaquah, Washington.
Windermere Mercer Island invites you to help in its back-to-school sneaker drive, known as the Kicks for Kids Shoe Drive, which serves the local communities to connect low-income youth with shoes for the upcoming school year. This year, we’re connecting with the Eastside Baby Corner, which is an amazing organization that helps kids thrive by providing resources and essentials with their 51 partner agencies – 26 of which are access to services through schools. The Eastside Baby Corner partners with charitable organizations throughout the Greater Seattle Area and helps them with the resources they need to best assist local families in need.
Help us make sure every child has a new pair of shoes for school!
ABOUT WINDERMERE MERCER ISLAND
We earn the trust and loyalty of our brokers and clients by doing real estate exceptionally well. The leader in our market, we deliver client-focused service in an authentic, collaborative and transparent manner and with the unmatched knowledge and expertise that comes from decades of experience.
© Copyright 2018, Windermere Real Estate/Mercer Island.