Facebook
 Twitter
 Pinterest
 Copy Link
How Did Seattle Real Estate Fare in 2020?

Our local real estate market overcame all odds in the surreal and tumultuous year laid at our doorstep. Despite many economic woes, home sellers were the big winners in 2020 as too few homes for sale could not keep up with increased buyer demand, leading to the most aggressive multiple offer bidding wars we have seen in decades—and likely ever.
Ridiculously low mortgage interest rates—below 3% for much of the year—were the primary factor motivating buyers to purchase as monthly mortgage payments looked increasingly attractive compared to rent. Our new work-from-home environment was also a contributing factor as the desire to improve one’s current living situation became paramount to many who were now spending most of their waking hours at home.
The Seattle and Eastside markets operated very independently from each other as prominent tech companies announced significant expansion or relocation in Bellevue, Redmond and Kirkland and Seattle struggled with civil unrest and new employer taxation concerns.
Driven by buyer demand, both regions did see an increase in Median Sale Price with the Eastside up 10% and Seattle up 6% over 2019. With multiple offer bidding wars being the norm rather than the exception, 60% of all Seattle homes and 62% of all Eastside homes sold went under contract in the first 10 days on the market at an average of 104% of their listed price in both Seattle the Eastside.
While consumer confidence continues to be challenged by local and national events—including COVID, unemployment, racial inequality, and our political environment—the desire to secure the best home environment possible, coupled with record low mortgage interest rates, continues to fuel local buyer demand. For many, COVID has changed perceptions of what is important. More buyers are reaching for their dream home or a second home in lieu of travel and other purchases.
Home affordability is quickly becoming one of the most prominent emerging concerns. Most homes are now unaffordable to first-time buyers and moderate wage earners who are finding it increasingly difficult to work in higher cost communities. Expect this issue to be at the center of any housing market discussion in years to come.
Click or scroll down to find your area report:
Seattle | Eastside | Mercer Island | Condos | Waterfront
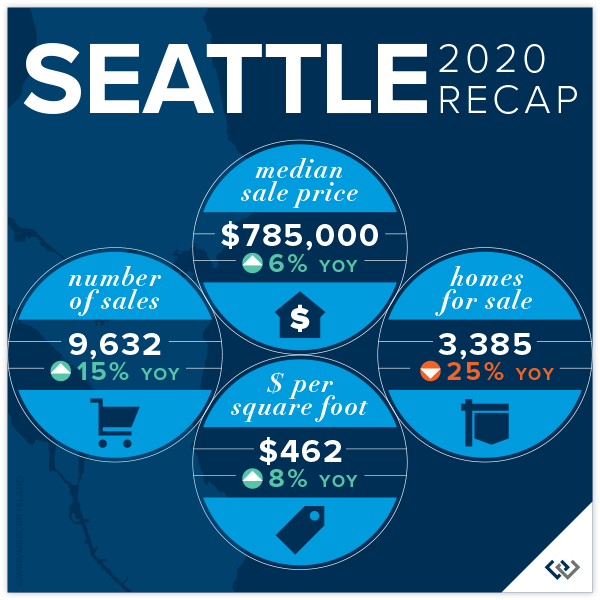
SEATTLE
Seattle’s Median Sale Price increased by 6% to $785,000 over $740,000 in 2019. North Seattle (+8%), South Seattle (+7%), and Queen Anne-Magnolia (+7%) outperformed the average while Central Seattle (+2%) and West Seattle (+4%) lagged.
Most notable for the year was a 15% increase in the number of Seattle homes sold in 2020 (9,632) compared to 2019 (8,362). Central Seattle (+25%) and Queen Anne-Magnolia (+21%) had the largest increase in homes sold. Lake Forest Park-Kenmore saw a decrease in the number of sales (-2%).
69% of all Seattle homes, and 16% of those priced above $1 million, sold at or above their listed price. The most competitive Seattle markets were Kenmore-Lake Forest Park and North Seattle, with sales in the first 10 days averaging 105% of their listed price.
The highest Seattle home sale was a 2014-built, 5612 square foot Washington Park waterfront home for just shy of $14.3 million and the lowest was a 1979-built, 162 square foot approved floating home in a leased slip on Lake Union (Ballard-Green Lake) for $134,000.
Click here for the full report and neighborhood-by-neighborhood statistics!

EASTSIDE
The Eastside’s Median Sale Price was $1,021,000 in 2020, up 10% over 2019 ($930,000) with the most significant gains in the second half of the year. East Bellevue (+12%) and the Eastside south of I-90 (+11%) outperformed the average while Mercer Island (+3%) and Redmond (+3%) had the smallest year-over-year increases.
69% of all Eastside homes, and 34% of homes priced above one million dollars, sold for at or above their list price. The entire Eastside market remained ultra-competitive throughout the year with East Bellevue sales topping the charts with an average sale price 106% above list price.
The Eastside market saw Months of Inventory (the number of months it would take to sell all homes currently for sale) drop well below 1 month for most of the year and end the year with the coffers nearly empty. Despite the limited supply of homes for sale, the total number of homes sold increased slightly by 5% to 7,641.
The highest sale was a record-setting $60 million, 2012-built Hunts Point estate with 356 feet of waterfront and the lowest sale was a 1924-built Skykomish cabin for $130,000.

Click here for the full report and neighborhood-by-neighborhood statistics!

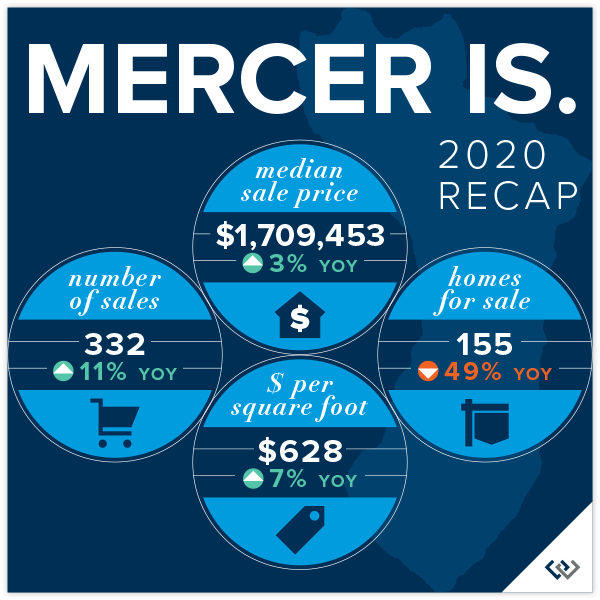
MERCER ISLAND
An astounding 123, of the Island’s 332 sales in 2020, were of homes priced above $2 million. There were only 11 sales below $1 million. Mercer Island waterfront listings were virtually all but depleted in the second half of the year as buyers snapped up their dream lifestyle opportunities.
As the year came to an end, there were only 9 homes for sale Island-wide—a new historic low for Mercer Island three times over. This shortage of available homes on the market has led to an extremely competitive market for the most desirable homes, especially those offering one-level living, a main floor owner’s suite or prime waterfront.
58% of all homes, and 16% of homes priced above two million dollars, sold at or above their listed price. The highest Mercer Island sale was a $11.2 million, Forest Avenue waterfront home on the Westside with 178 feet of waterfront. The lowest sale was a $815,000 West Mercer rambler sold at land value.
Click here for the full report and neighborhood-by-neighborhood statistics!
CONDOS – SEATTLE & EASTSIDE
Housing affordability due to ultra-low interest rates and lifestyle choices sculpted condominium ownership in 2020. Condos offered an attractive and often more affordable option for entry-level buyers who might otherwise rent. Alternatively, many buyers who might previously have chosen a condo living environment found the idea of a single-family home (if they could snag one) more compelling.
The concept that real estate is local applied more to condos this year than ever before. Condo stats in both Seattle and Eastside neighborhoods varied from one to the next so significantly that looking at the overview stats is almost meaningless. As a result, we’ve delved into the community details as much as possible in our market summary below.
NUMBER FOR SALE – While the number of single-family homes for sale has been on the decline, several condo markets experienced substantial year-over-year increases. The number of units for sale in West Bellevue (+55%), Mercer Island (+55%), Sammamish (+48%), Central Seattle (+45%), Redmond (+41%), West Seattle (+38%), and Downtown Seattle (+32%) were all up markedly over 2019. The third quarter of 2020 was the most active quarter in number of sales for every region except Bellevue and Kirkland—which had the most activity in the fourth quarter.
NUMBER SOLD – Downtown Seattle (+47%) and West Bellevue (+45%) both saw record increases in the number of units sold compared to 2019. While some of rise in sales can be attributed to COVID-motivated movement away from dense housing environments and urban flight, much of it was due to the final completion and closing of new construction units. South Seattle (+29%), Mercer Island (+28%), Ballard-Green Lake (+25%), and Kirkland (+23%) also saw noteworthy increases in their year-over-year numbers.
MEDIAN SALE PRICE – West Bellevue saw a 42% increase in year-over-year Median Sale Price, mostly influenced by the completion of the Bosa 188 project. Kirkland (+17%), Redmond (+16%), Woodinville (+16%) also saw significant Median Sale Price increases in 2020 while Downtown Seattle was the only area to see no increase from 2019.
% OF ASKING PRICE – 57% of Seattle condos and 65% of Eastside condos sold at or above their listed price. 38% of Seattle condos and 55% of Eastside condos sold in the first 10 days on the market for an average of 101% and 102% of their asking price, respectively. Downtown Seattle’s lack of appreciation in 2020 made it relatively more affordable and resulted in 61% of all listings selling at or above their list price.
Check out area-by-area details the full condo report.

WATERFRONT
Fifteen waterfront sales topped the $10 million benchmark in 2020 as the local waterfront home market came alive amid international trends focusing on home and lifestyle. A shortage of supply in available homes for sale dominated the waterfront scene, which typically has a glut of inventory for sale, resulting in the scooping up of nearly everything on the market by the year’s end.
The Eastside had 46 waterfront sales, including a record-setting $60 million 2012-built Hunt’s Point estate with 356 feet of coveted waterfront. The Eastside ended the year with just 10 waterfront homes for sale from Kenmore to Kennydale.
Mercer Island had a good year with 31 waterfront sales in 2020 and ended the year with only 2 waterfront homes for sale, both on the east side of the Island. The highest sale was an $11.2 million Forest Avenue abode with 9,790 square feet on 178 feet of west side waterfront.
Lake Sammamish also enjoyed 31 waterfront sales of its own during the year. The highest sale was of an 11,750 square foot 2006-built home on the west side of the lake for $6.4 million. There were just 3 waterfront homes for sale on Lake Sammamish at year end.
We saw much the same story in Seattle with 43 waterfront sales in 2020 and only 8 homes for sale at the end of the year. The highest Seattle sale was a $14.3 million Washington Park home sited on 60 feet of Lake Washington waterfront.
This top-level overview of the entire Seattle-Eastside private waterfront market, including Mercer Island and Lake Sammamish, provides a glance into the trends occurring in our region over time. It is interesting, and insightful, but in no way replaces an in-depth analysis on waterfront value provided by a knowledgeable broker with years of local waterfront experience.

Find a Home | Sell Your Home | Property Research
Neighborhoods | Market Reports | Our Team
We earn the trust and loyalty of our brokers and clients by doing real estate exceptionally well. The leader in our market, we deliver client-focused service in an authentic, collaborative and transparent manner and with the unmatched knowledge and expertise that comes from decades of experience.
2737 77th Ave SE, Mercer Island, WA 98040 | (206) 232-0446 mercerisland@windermere.com
© Copyright 2021, Windermere Real Estate/Mercer Island. Information and statistics derived from Northwest Multiple Listing Service and deemed accurate but not guaranteed.
Safe Holiday Events Around Seattle


Have some holiday cheer, 2020 style! While traditional gatherings may be off the table, you can still make the most of the season with a new take on these favorite local events. Safety is foremost with virtual platforms or a combo of social distancing & mask protocols. Just be sure to reserve your tickets early as attendance is limited this year. Scroll down for the details…
WildLanterns at Woodland Park Zoo
5500 Phinney Ave. N, Seattle, WA 98103
www.zoo.org/wildlanterns
click here to get tickets
- Dates/Times: Open Tues-Sun, 11/13/20 – 1/17/21 | 4:00 – 8:30 pm
- Cost: $23.95 – $28.95 per person (ages 2 and under are free)
- COVID Protocols: Masks covering the mouth and nostrils are required for everyone age 5 and up, and encouraged for ages 3-5 as well. Mesh/lace/exhaust valve style masks are not accepted. Limited admission during purchased time slot only. Social distancing.
- Promotions: Zoo members get 20% off tickets.
- Parking: $4 parking is available in all zoo lots
- Food: Outdoor and grab-&-go refreshments are available at the pizza trailer on the North Meadow, and at Gather and Graze (with covered seating provided). You are also welcome to bring your own food and non-alcoholic beverages.
- Event map
- Closures: November 26, December 24 & 25

Image courtesy of Woodland Park Zoo WildLanterns
Virtual Winterfest at Seattle Center
305 Harrison Street, Seattle, WA 98109
www.seattlecenter.com/winterfest
- Dates: 11/27/20 – 12/31/20
- Cost: Free for all ages
- Parking: Paid parking available at the Mercer Garage, 5th Ave N Garage, and Theatre Commons Lot. Click here for the campus map
- Food: A multitude of dining options await you in the Armory
- Special events:
- Campus Luminata, with specialty light features across the grounds after dark (including a special display at Cornish Playhouse)
- Virtual student showcases
- PTSA Reflections Virtual Art Exhibit
- Winterfest Coloring Contest
- Campus Luminata, with specialty light features across the grounds after dark (including a special display at Cornish Playhouse)
A Christmas Carol by ACT Theatre
Radio-style audio play streamed on-demand at your convenience
https://acttheatre.org/a-christmas-carol-2020
click here to get your ticket
- Dates/Times: Streaming on-demand 11/27/20 – 12/27/20
- Cost: $20-$45 per household
- Promotions: For households purchasing tickets at the $45 level, get your name and a special message added to the ACT website as a memento of the play
Reimagined Snowflake Lane at the Bellevue Collection
Bellevue Way & NE 8th Street, Bellevue WA 98004
http://snowflakelane.com/
- Dates/Times: Nightly 11/27/20 – 12/24/20 | 5-9 pm
- Cost: Free for all ages
- COVID Protocols: Masks and social distancing
- Parking: Free parking at Bellevue Square, Bellevue Place and Lincoln Square
- Special Events: Intermittent snow & holiday music, virtual tree lighting on Friday, 11/27 viewable at snowflakelane.com.

Image courtesy of snowflakelane.com
Westlake Center Virtual Tree Lighting & Holiday Activities
400 Pine St., Seattle, WA 98101 (Westlake Park)
https://downtownseattle.org/events/holidays/
- Dates/Times: Virtual tree lighting ceremony live-streamed on 11/27/20 at 5pm. Holiday light displays & augmented reality adventure 11/27/20 – 1/9/21.
- Cost: Free for all ages
- COVID Protocols: Masks and social distancing for in-person activities
- Parking: Access the Republic Parking garage from Olive Way between 4th & 5th Ave, or check out this interactive map of city parking
- Food: Food trucks will be at Westlake Park daily.

Zoolights at Point Defiance Zoo & Aquarium
5400 N Pearl St, Tacoma, WA 98407
www.pdza.org/event/zoolights
click here to get tickets
- Dates/Times: Open nightly 11/27/2020 – 1/3/2021 | 5 – 9 pm
- Cost: $10-$14 (free for kids 2 & under)
- COVID Protocols: Masks covering the mouth and nostrils are required for everyone age 5 and up, and encouraged for ages 3-5 as well. There are special dates/times for those with medical conditions that prevent them from wearing a face covering. Limited admission during purchased time slot only. Social distancing.
- Promotions: Discounted tickets for zoo members; BECU members save $1
- Parking: Free parking in zoo lots
- Food: Grab to-go dinner, drinks or snacks from the Plaza Cafe & food stands
- Holiday Closures: December 24th & 25th

Image courtesy of https://www.pdza.org
Find a Home | Sell Your Home | Property Research
Neighborhoods | Market Reports | Our Team
We earn the trust and loyalty of our brokers and clients by doing real estate exceptionally well. The leader in our market, we deliver client-focused service in an authentic, collaborative and transparent manner and with the unmatched knowledge and expertise that comes from decades of experience.
2737 77th Ave SE, Mercer Island, WA 98040 | (206) 232-0446 mercerisland@windermere.com
© Copyright 2019. Information and statistics derived from Northwest Multiple Listing Service.
Give Back This Season


In his poem, When Giving Is All We Have, Alberto Álvaro Ríos wrote,
“We give because someone gave to us.
We give because nobody gave to us.
We give because giving has changed us.
We give because giving could have changed us.”
With need especially keen this year during the pandemic, many of us are looking for ways to be “the helpers” for others. Below are some of our favorite Seattle-area organizations who are in need of time, resources, toys, and more to help improve the lives of homeless and low-income families in our area. You might also check out these tips on how to make the most of charitable giving. Together we can make the holidays a little brighter for everyone!

Each night in King County, almost 1,100 unaccompanied youth and young adults experience homelessness on any given night, and around 70% of these youth sleep outside because of lack of shelter or housing. Why? A national study found that over 90% of homeless youth reported family conflict and 1/4 suffered from abuse and neglect before they reached the streets. YouthCare builds confidence and self-sufficiency for homeless youth by providing a continuum of care that includes outreach, basic services, emergency shelter, housing, counseling, education, and employment training. Lend a hand by participating in the Survival Needs Drive, delivering a warm meal, donating cash or most needed items, hosting a virtual fundraiser, or hiring a YouthCare graduate.
http://youthcare.org/
(206) 694-4500
2500 NE 54th Street, Seattle
![]()
Northwest Harvest’s mission is to end hunger in Washington. They partner with 375 food pantries, meal programs, and high-need schools across the state to provide nutritious food and promote good health for those in need. You can help by hosting a virtual food drive, making a cash donation, or volunteering (children age 9 and up can volunteer with you!).
http://www.northwestharvest.org/
1 (800) 722-6924
SODO Community Market Food Bank: 1915 4th Ave S, Seattle
Kent Warehouse: 22220 68th Ave S, Kent

Mary’s Place helps homeless women, children and families from the greater King County area. You can help by participating in their giving tree tag program now through December 11th. You can also volunteer your time, donate wishlist items, or share your used clothing, blankets, and coats.
http://www.marysplaceseattle.org
(206) 621-8474
Donation Center in SODO: 9 South Nevada St, Seattle
Mary’s Place at the Regrade: 720 Blanchard St, Seattle
![]()
Hopelink provides critical services to homeless and low-income families, children, seniors, and people with disabilities on north and east King County. You can help by donating food or grocery gift cards to their food bank, or making a cash donation to support their “Lend a Hoping Hand” holiday giving campaign.
https://www.hopelink.org/
(425) 869-6000
8990 154th Ave NE, Redmond

Did you know less than 50% of Washington state youth in foster care graduate from high school? Treehouse seeks to level the playing field by providing academic and other essential support foster kids need to graduate at the same rate as their peers, with a plan for their future. You can help by hosting a holiday drive, purchasing items on their holiday wish list, volunteering, or donating.
https://www.treehouseforkids.org/
(206) 767-7000
2100 24th Avenue S./Suite 200

With a mission to help people in need of immediate food assistance, the Emergency Feeding Program partners with 120 local agencies to distribute 42,000 meals of quality, nutritional food per week and ensure that no one will go hungry tonight. With volunteering limited this year due to COVID, your cash contribution would be most appreciated.
https://www.emergencyfeeding.org/
(425) 277-0300
851 Houser Way N, Suite A, Renton
![]()
Eastside Baby Corner was founded by a local pediatric nurse concerned about the large numbers of babies in her practice who began life without basic essentials like adequate food, clothing, beds, or safety equipment. Today Eastside Baby Corner’s locations in Issaquah, Northshore and Bremerton collect, purchase, and distribute essential care items such as formula, diapers, car seats, warm coats, school supplies, and more for babies and children in need. You can help out by donating goods or cash, shopping off their wish list, volunteering or organizing a drive.
Eastside Baby Corner:
http://babycorner.org
(425) 865-0234
1510 NW Maple St, Issaquah
![]()
Last year, King County Toys for Tots donated 85,169 toys to 61,092 local children in need. Consider helping out this year by making a cash donation, or asking your organization to become a toy drop site.
https://fort-lewis-wa.toysfortots.org
Coordinator: GySgt Edward Chapman, 760-405-3203
**2020 toy donation locations and times to be announced**

Every year, nearly 40% of our country’s food ends up in landfills, while millions go hungry. Food Lifeline attempts to solve both problems by rescuing millions of pounds of surplus food from farmers, manufacturers, grocery stores, and restaurants. They then deliver this healthy and nutritious food to more than 300 food banks, shelters and meal programs across Western Washington–providing the equivalent of 116,000 meals every day for hungry children, adults and seniors. You can help by volunteering (opportunities are available for kids as young as 6, too!), donating funds or hosting a food drive.
https://foodlifeline.org/
(206) 545-6600
815 S 96th St, Seattle

Wellspring helps low-income and vulnerable individuals, children and families in Seattle and King County address issues such as mental health, family homelessness, early learning, basic needs, and domestic violence intervention. Each year they help thousands of children and families break cycles of instability, homelessness, and adversity to achieve positive, permanent change. You can help by donating to their Giving Together holiday campaign or getting your children involved in the Kids Helping Kids youth philanthropy program.
http://wellspringfs.org/
(206) 826-3050
1900 Rainier Avenue South, Seattle
![]()
Founded and run by a group of philanthropic women over 100 years ago, Seattle Children’s mission is to provide hope, care and cures to help every child live the healthiest and most fulfilling life possible. You can help their patients by donating a new toy or gift card, volunteering, contributing funds, or supporting one of its guilds (such as the Project Kids Cancer Cure Guild).
http://www.seattlechildrens.org
(206) 987-2000
4800 Sand Point Way NE, Seattle
Find a Home | Sell Your Home | Property Research
Neighborhoods | Market Reports | Our Team
We earn the trust and loyalty of our brokers and clients by doing real estate exceptionally well. The leader in our market, we deliver client-focused service in an authentic, collaborative and transparent manner and with the unmatched knowledge and expertise that comes from decades of experience.
2737 77th Ave SE, Mercer Island, WA 98040 | (206) 232-0446 mercerisland@windermere.com
© Copyright 2020, Windermere Real Estate / Mercer Island
Q3 2020 Reports: Market Update


The volume of Q3 transactions made up for Q2’s fewer sales and then some. Truth be told, the market could have absorbed twice the number of transactions, if only there were more homes on the market to sell. Too few homes for sale is the defining character of the Q3 Seattle region real estate market as evidenced by multiple offer bidding wars being the norm rather than the exception. Nearly 66% of all homes sold went under contract in the first 10 days on the market at an average of 103% of their listed price in Seattle and 105% of that price on the Eastside.
As predicted by Windermere’s chief economist, Matthew Gardner, the second half of 2020 is indeed shaping up to be the brightest spot in our local economy. While consumer confidence continues to be challenged by local and national events—including COVID, unemployment, racial inequality, and uncertainty around the presidential election—the desire to secure the best home environment possible coupled with ridiculously low mortgage interest rates continue to fuel local buyer demand.
In addition to typical real estate activity, new and changing home needs (especially for those working virtually with children) have driven many to question the adequacy of their current living situation. This has added to the already significant buyer demand we are experiencing. For many, COVID has changed their perception of what is important. More buyers are reaching for their dream home or a second home in lieu of world travel and luxury goods.
As demand drives up local home prices further, affordability is quickly becoming one of the most prominent emerging concerns. Currently only a sliver of homes are considered affordable to first time buyers at their projected median income. Teachers, first responders, and critical infrastructure workers that keep our region going are finding it increasingly difficult to work in higher cost communities. Will our children be able to buy a home in the Seattle region? Not unless something changes to create lower cost housing options. One does not need a crystal ball to see that this problem will get worse when mortgage interest rates increase closer to their norms. Expect this issue to be at the center of any housing market discussion in years to come.
Click or scroll down to find your area report:
Seattle | Eastside | Mercer Island | Condos | Waterfront
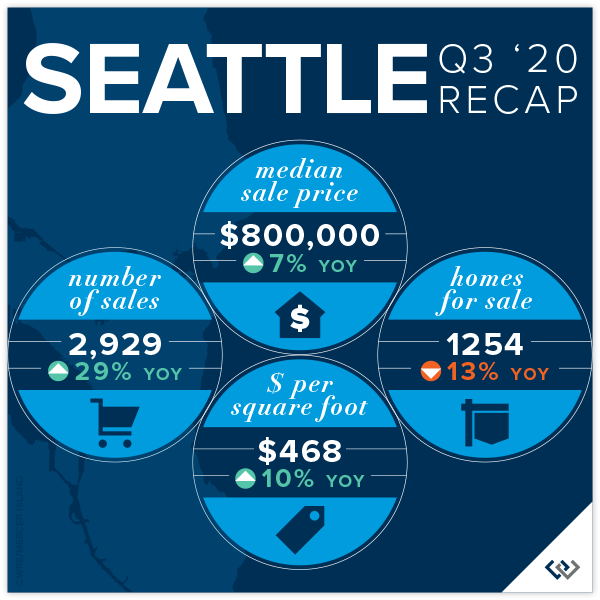
SEATTLE
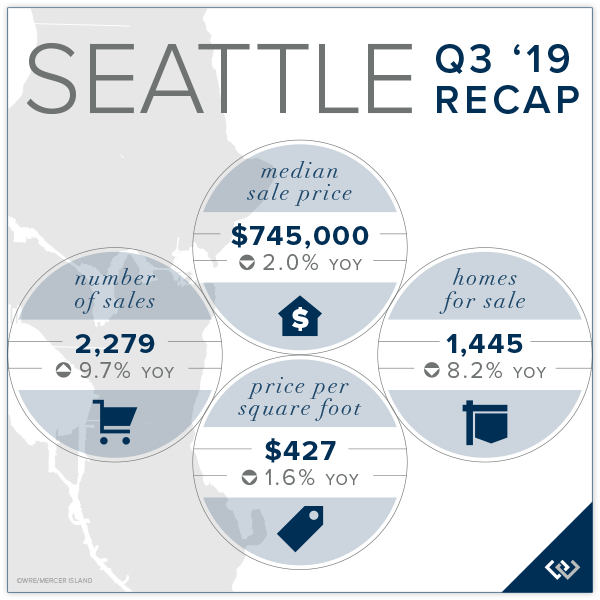
Seattle’s median sale price increased by 3% (to $800,000) over Q2 ($780,000) and by 7% over Q3 2019 ($749,000). Neighborhoods to the north experienced the largest increase in median sale price with Kenmore-Lake Forest Park (+10%) and Shoreline-Richmond Beach (+8%) over Q2. In addition, Queen Anne-Magnolia, North Seattle, Shoreline-Richmond Beach, and South Seattle all saw double-digit increases over Q3 of 2019.
71% of Seattle homes (all price points), and 18% of homes priced above $1 million, sold at or above their listed price. The most competitive Seattle markets were Kenmore-Lake Forest Park and North Seattle, with sales in the first 10 days averaging 107% and 106% of their listed price, respectively.
There were 50% more Seattle home sales in Q3 (2,929) than in Q2 (1,956) and 29% more sales than in Q3 of 2019 (2,279).
The highest Seattle home sale was a 2014-built, 6400 square foot Laurelhurst (North Seattle) waterfront home for just shy of $11.5 million and the lowest was a 1982-built, 240 square foot approved floating home in a leased slip on Lake Union (Ballard-Green Lake) for $187,500.
Click here for the full report and neighborhood-by-neighborhood statistics!

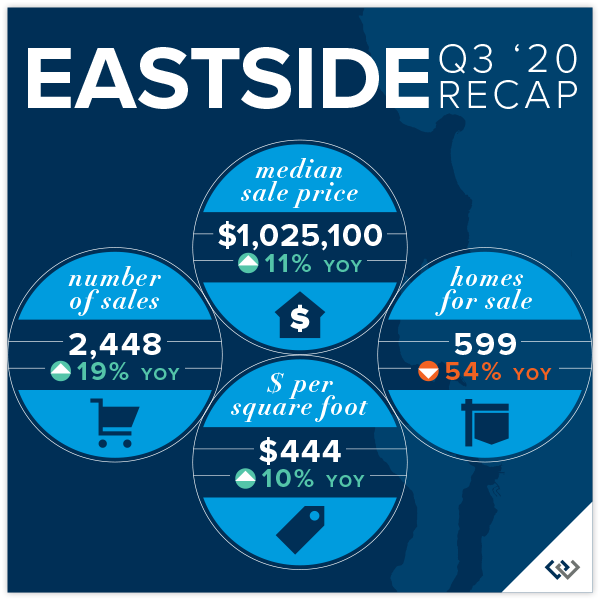
EASTSIDE
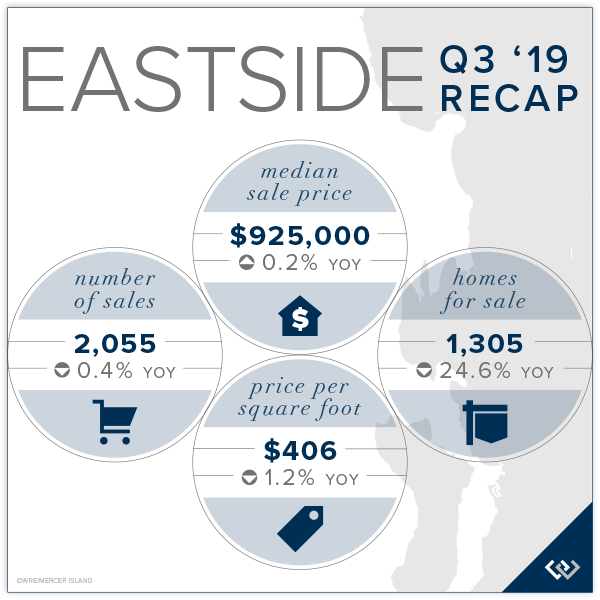
The Eastside median sale price broke the million-dollar barrier, coming in at $1,025,100 in Q3, up 7% over Q2 ($958,000) and 11% over Q3 2019 ($925,000). Kirkland-Bridle Trails (+18%) and the Eastside South of I-90 (+10%) performed best over Q2. while Eastside South, East Bellevue, West Bellevue, and East Lake Sammamish all saw double-digit increases over Q3 2019.
67% of Eastside homes, and 32% of homes priced above one million dollars, sold for at or above their listed price. The most competitive Eastside markets were East Bellevue, Mercer Island and Redmond-Carnation, with sales in the first 10 days averaging 105%, 104% and 104% of their listed price, respectively.
There were 56% more Eastside home sales in Q3 (2,448) than in Q2 (1,570) and 19% more sales than in Q3 of 2019 (2,055).
The highest sale was a $23.5 million 1908-built Hunts Point estate on 1.59 acres sold off-market and the lowest sale was a 1960-built Stossel Creek fixer without documented well or septic on 4.79 acres in Duvall for $235,000.
Click here for the full report and neighborhood-by-neighborhood statistics!
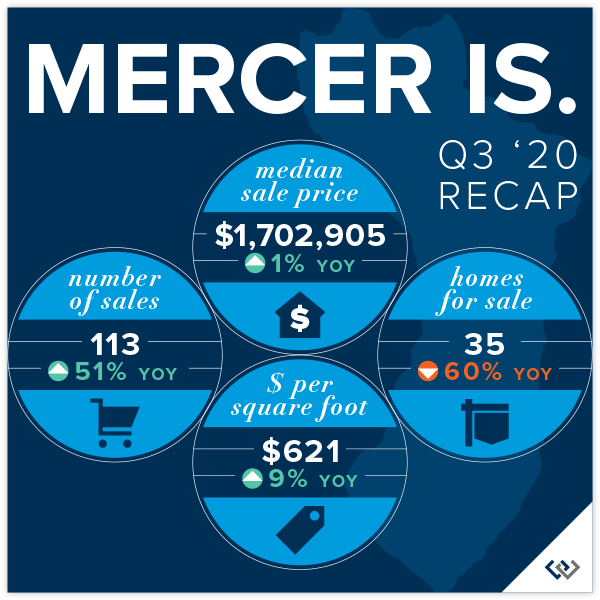
MERCER ISLAND
Of Mercer Island’s 113 Q3 sales, all but two were for over $1 million and 41 were above $2 million. There were 14 sales above $3 million in Q3, compared to only 4 in Q2.
As the quarter came to an end, there were only 35 homes for sale compared to 75 in Q3 2019. This shortage of available homes on the market has led to an extremely competitive market for the most desirable homes, especially those offering one-level living or a main floor owner’s suite.
58% of all homes, and 16% of homes priced above two million dollars, sold for at or above their listed price.
The highest Mercer Island sale was a $10.2 million, Faben Point waterfront home. The lowest sale was a $925,000 North End fixer sold at land value.
Click here for the full report and neighborhood-by-neighborhood statistics!
CONDOS – SEATTLE & EASTSIDE
The number of Seattle condos for sale has increased markedly, and while the pace of sales is up, it is nonetheless struggling to keep up with the volume of condos coming to market. Condos fared well overall with a median sale price up by 5% (to $479,925) over Q2 ($455,000) and by 9% over Q3 2019 ($438,500). Condos in Shoreline-Richmond Beach, Queen Anne-Magnolia, and South Seattle experienced double-digit increases in median sale price while the Downtown-Belltown median sale price was 6% lower than Q2.
54% of Seattle condos (all price points), and 4% of those priced above $1 million, sold at or above their listed price. 48% sold in the first 10 days on the market. There were 68% more Seattle condo sales in Q3 (784) than in Q2 (468) and 11% more sales than in Q3 of 2019 (706).
On the Eastside, the median sale price was down 5% to $499,950 in Q3 following a record setting Q2 ($525,000), but up 6% over Q3 2019 ($471,000). Condos in Kirkland-Bridle Trails (+13%) and West Bellevue (+11%) saw increases in median sale price while the Eastside South of I-90 (-15%) and East Bellevue (-17%) saw declines from Q2.
60% of Eastside condos (all price points), and 3% of those priced above $1 million, sold at or above their listed price. 49% sold in the first 10 days on the market. There were 72% more Eastside condo sales in Q3 (755) than in Q2 (440) and 17% more sales than in Q3 of 2019 (643).
Check out area-by-area details the full condo report.
WATERFRONT
Waterfront rebounded in a big way in Q3 with record setting sales velocity. The Eastside had more sales this quarter (18) than the last three prior quarters combined. The supply of inventory fell to 3 months (from an average of 10 months of supply) with only 16 waterfront homes for sale at quarter end. Lake Sammamish posted 14 sales after a sleepy prior four quarters with a combined total of 14 sales. For sale inventory is in step with the Eastside at 3 months of supply (from an average of 5 months of supply).
Mercer Island saw 12 waterfront sales in Q3, a sharp increase from its average of five sales per quarter. With only 8 waterfront homes on the market, Mercer Island’s available inventory fell from an average 12 months to just 2 months of supply. Seattle posted 12 sales, maintaining its typical pace of sales. There were 17 waterfront homes for sale at the end of Q3 and Seattle’s for sale inventory remained a steady 4 months of supply.
The highest sale was a $23.5 million 1908-built Hunts Point estate on 1.59 acres sold off-market with 138 feet of premium Lake Washington waterfront. The most affordable was a $1.1 million Holmes Point home built in 1928 with 36 feet of waterfront on the lake.
This top-level overview of the entire Seattle-Eastside private waterfront market, including Mercer Island and Lake Sammamish, provides a glance into the trends occurring in our region over time. Interesting, and certainly insightful, it in no way replaces an in-depth analysis on waterfront value provided by a savvy broker with years of local waterfront experience.
Find a Home | Sell Your Home | Property Research
Neighborhoods | Market Reports | Our Team
We earn the trust and loyalty of our brokers and clients by doing real estate exceptionally well. The leader in our market, we deliver client-focused service in an authentic, collaborative and transparent manner and with the unmatched knowledge and expertise that comes from decades of experience.
2737 77th Ave SE, Mercer Island, WA 98040 | (206) 232-0446 mercerisland@windermere.com
© Copyright 2020, Windermere Real Estate/Mercer Island. Information and statistics derived from Northwest Multiple Listing Service and deemed accurate but not guaranteed.
Q2 2020 Reports: Market Update


Q2 was a story of resilience for the Seattle market. It began with our region fully entrenched in a new normal amidst the COVID-19 pandemic, but ended with a strong seller’s market and historic low interest rates. Buyers have returned in droves to battle for the limited supply of homes for sale. With a shortage of listings due both to economic/health concerns and sellers who can’t find anywhere to go, we could double our current supply of homes for sale and still fall short of demand.
Our region’s typical peak season was delayed with April feeling more like February and picking up momentum through the end of June. Possibly motivated as much by the changing home requirements of our newly revised lifestyles as it is by the opportunity to snag a coveted mortgage interest rate (a 1% change in interest rate equates to a 10% change in buying power), buyers are eager to find a place to call home.
Residential home prices are generally up throughout the region in Q2 while condominium prices are mixed depending on the building amenities and how well they have addressed COVID-19 concerns.
Click or scroll down to find your area report:
Seattle | Eastside | Mercer Island | Condos | Waterfront
SEATTLE
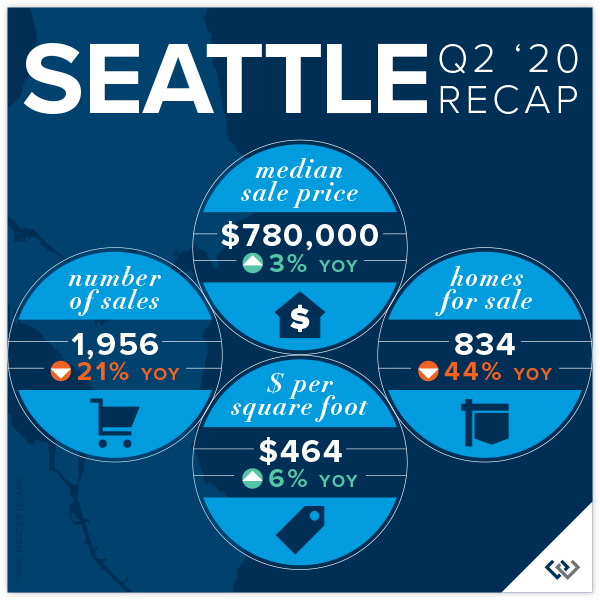
Seattle’s median sale price increased by 3% in Q2 to $780,000. Queen Anne-Magnolia (+8%) and South Seattle (+7%) were top performers in the Seattle region while the Richmond Beach-Shoreline area was down 1% compared to Q2 2019.
68% of Seattle homes (all price points) sold at or above their listed price, while only 15% of homes priced above $1 million did so. The average number of days to sell decreased to 20 from 27 in Q2 of the year prior. There were 21% fewer Seattle home sales in Q2 2020 (1,956) compared to Q2 2019 (2,479) due to a shortage of homes for sale.
The highest Seattle home sale was a 2008-built Laurelhurst (North Seattle) waterfront home for $10,500,000 and the lowest was a 1979-built 1-bedroom approved floating home in a leased slip on Lake Union for $134,000..
Click here for the full report and neighborhood-by-neighborhood statistics!

EASTSIDE
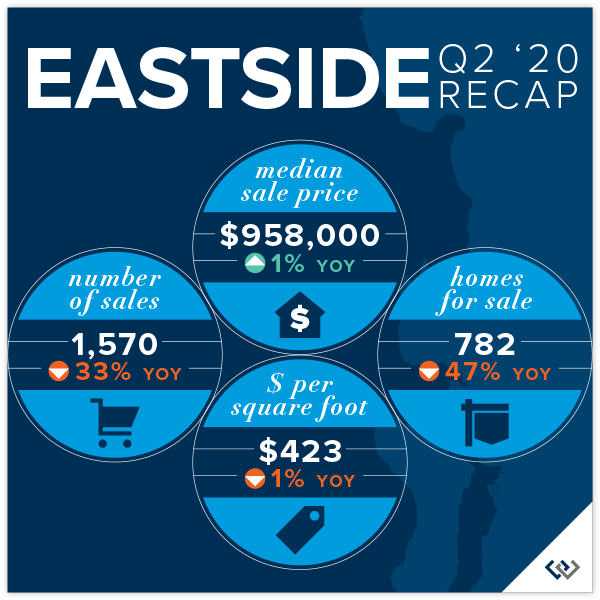
The Eastside median sale price was $958,000 in Q2, up 1% over Q2 2019. West Bellevue (+10%) and East Bellevue (+8%) performed best, while Mercer Island saw an 11% decrease in its median sale price with fewer luxury sales.
65% of Eastside homes, and 26% of homes priced above one million dollars, sold for at or above their listed price. The average number of days to sell decreased to 24 from 36 in Q2 of the year prior. There were 33% fewer Eastside home sales in Q2 2020 (1,570) compared to Q2 2019 (2,334) due to fewer homes available for sale.
The highest sale was a $11.75 million 2004-built Evergreen Point shared waterfront home on just over an acre and the lowest sale was a 1924 Skykomish cabin on Old Cascade Hwy.
Click here for the full report and neighborhood-by-neighborhood statistics!

MERCER ISLAND
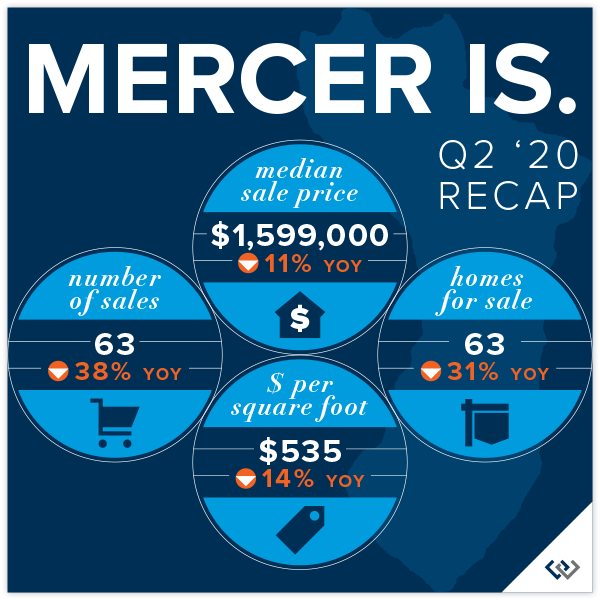
There was not a single Mercer Island home sale below $1 M in Q2. The bulk of Island sales were in the $1.2 M to $2 M price point (40 of 63 sales) and there were only four sales above $3 M.
The Island’s record shortage of homes for sale in Q2 continues to create a bottleneck of buyer activity with multiple offers common in the $1.2 M to $2 M segment of the market. Buyers are winning the competition by pre-inspecting and waiving typical contingencies more so that drastically escalating offer prices.
52% of all homes, and 8% of homes priced above two million dollars, sold for at or above their listed price. The highest Mercer Island sale was a $4.185 million, 2002-built Eastside waterfront home. Two “as-is” mid-island homes tied for the lowest sale of at $1,000,000.
Click here for the full report and neighborhood-by-neighborhood statistics!
CONDOS – SEATTLE & EASTSIDE
Condo sales have been more impacted by COVID-19 concerns than most residential homes. Condo buildings with individual outside access and those with stellar cleanliness policies tended to be more desirable than buildings that did not clearly address exposure concerns.
The Seattle median condo sale price was down 6% to $455,000 in Q2 as compared to Q2 2019 ($483,500). There were only 468 sales for the quarter vs. 764 sales in the same quarter last year. Downtown-Belltown condos (+6%) outperformed the region while Richmond Beach & Shoreline condos were down 20% over Q2 of the prior year (fewer higher end sales). 55% of Seattle condos (all prices), and 4% of condos priced above one million dollars, sold for at or above their listed price.
On the Eastside, the median sale price was up 9% to $525,000 (from $460,000 in Q2 2019). East Bellevue (+21%) and Redmond (+19%) condos far outpaced gains seen in surrounding cities. A total of 440 units sold on the Eastside this quarter. 65% of all Eastside condos, and 6% of those priced above one million dollars, sold for at or above their listed price.
Check out all of these factoids and more in the full condo report.
WATERFRONT
Sales of waterfront homes in Q2 with exclusive (not shared) access to the water picked up some momentum after a sleepy Q1 but remain far below typical norms. Seattle had 12 private waterfront home sales while Mercer Island and Lake Sammamish each had 5 sales and the Eastside had 4 sales.
Six (23%) of the 26 total sales closed at higher than their listing price, including one West of Market sale that went for $2 M above its listed price. Three sales (12%) closed right at their listed price and 17 (65%) closed below their listed price. Homes sold above their listed price sold in an average of 27 days for 11% higher than list. Homes sold below their listed price sold in an average of 125 days for 6% less than their listed price.
The highest Q2 private waterfront sale was in Laurelhurst at $10.5 million with 145 feet of Lake Washington waterfront. The most affordable was a $1.6 million West Lake Sammamish home with 50 feet of waterfront on the lake.
This top-level overview of the entire Seattle-Eastside private waterfront market, including Mercer Island and Lake Sammamish, provides a glance into the trends occurring in our region over time. Interesting, and certainly insightful, it in no way replaces an in-depth analysis on waterfront value provided by a savvy broker with years of local waterfront experience.
Find a Home | Sell Your Home | Property Research
Neighborhoods | Market Reports | Our Team
We earn the trust and loyalty of our brokers and clients by doing real estate exceptionally well. The leader in our market, we deliver client-focused service in an authentic, collaborative and transparent manner and with the unmatched knowledge and expertise that comes from decades of experience.
2737 77th Ave SE, Mercer Island, WA 98040 | (206) 232-0446 mercerisland@windermere.com
© Copyright 2020, Windermere Real Estate/Mercer Island. Information and statistics derived from Northwest Multiple Listing Service and deemed accurate but not guaranteed.
How to Buy and Sell Safely in the New Normal


While buying and selling real estate was recently deemed essential in Washington State, the landscape looks very different than it did before the COVID-19 outbreak. Real estate offices remain closed to the public with agents (like me) working remotely and hosting virtual client meetings. Important safety regulations prohibit in-person open houses and limit the number of people who can tour a home or attend an inspection. Social distancing will remain at the forefront as we wait for a vaccine or treatment to become widely available.
So how do you buy or sell a home safely in this new environment? Thanks to modern technology, there is a lot I can do to help you through the process while minimizing the risk to you and the community. Here are some tips on how to do it right…


TIPS FOR BUYERS
- Do your homework before you tour a home in person. Take a virtual online tour, research the neighborhood and ask your agent to delve into the property and title history. If a virtual tour isn’t available, your agent can give you a preview via FaceTime or Skype while walking through the home.
- Get pre-qualified. Knowing your exact budget in advance will help you save time and avoid any non-essential showings.
- Schedule a 1-hour showing window. When you think you’ve found “the one” and are ready to tour it in-person, have your agent book a full hour so that you are less likely to run into other buyers. This will also allow time for each person to see the home since there is currently a limit of just 2 people in the home at once, including the agent.
- Meet your agent at the home. Instead of carpooling, drive separately and then wait in your car until your agent confirms that the home is empty and ready to tour. Condos may have special rules for showings and you’ll also want to take separate elevator trips if you’re touring a high-rise.
- Play it safe during the tour. Wear a mask, wash/sanitize your hands when you enter and leave, limit touching of surfaces, and maintain at least 6 feet of social distance from your agent at all times. Assume you might be recorded by the homeowner and observed by neighbors.
- Meet virtually with your agent. When it’s time to write an offer, your agent can use any number of video conferencing apps to share documents with you and discuss them in real time. You can then sign and authenticate all contracts electronically via a secure service such as Authentisign.
- Don’t skip a professional home inspection. Due to the difficulties around seeing the home in person, it is more important than ever to make sure you know of any underlying issues it may have. The 2-person rule still applies at inspections so your agent will likely request the seller’s permission for you to be in the home alone with the inspector while the agent waits in the car. You’ll also need to make sure you and your inspector comply with all social distancing and safety rules.

TIPS FOR SELLERS
- Give your listing agent a virtual tour. Rather than meeting in person, utilize an app like FaceTime or Skype to virtually walk your agent through your home using your smart phone. Hold meetings virtually whenever possible and sign documents electronically through a secure service such as Authentisign.
- Move out first if at all possible. This makes it practical for buyers to comfortably view your home while following the current 2-person limit for home occupancy during showings. It also protects you from any potential exposure—especially important if you are in at at-risk age group and/or have health problems.
- Time the market with expert advice. Talk to an agent you can trust who follows the ins and outs of regulations from the Governor’s office and also has access to showing data and activity reports that can help you determine the best time to sell.
- Look your best online. Make sure your agent will coordinate truly stellar home preparation, staging and photography. Consider having a professional video tour and interactive floor plans as well.
- Have your agent hold a virtual open house. Live-streaming a virtual tour from inside the home is a great way for your agent to reach buyers and answer their questions in real time. Virtual open houses are also now promoted on virtually all home search websites and apps.
- Prepare diligently for in-person showings. Be sure that you or your agent provides hand sanitizer, single-use booties and masks along with a sign detailing the safety guidelines you would like visitors to follow while in your home. Open interior doors and turn on lights ahead of time to minimize touching. Disinfect high-use surfaces after each showing.

Find a Home | Sell Your Home | Property Research
Neighborhoods | Market Reports | Our Team
We earn the trust and loyalty of our brokers and clients by doing real estate exceptionally well. The leader in our market, we deliver client-focused service in an authentic, collaborative and transparent manner and with the unmatched knowledge and expertise that comes from decades of experience.
2737 77th Ave SE, Mercer Island, WA 98040 | (206) 232-0446
© Copyright 2020, Windermere Real Estate / Mercer Island
Q1 2020 Reports: Market Update


As we are fully entrenched in a new normal amidst the COVID-19 pandemic, it is important to note that the Q1 stats you see are based on pre-coronavirus closed sales activity and therefore largely untouched by our current market reality.
While Q1 serves as a pre-coronavirus benchmark, Q2 and Q3 will more accurately show the impacts of the (necessary) stay home order and resulting economic fallout. Our region stands to rebound more quickly than many US markets due to its pre-coronavirus strength.
Q1 saw a continued inventory shortage, although many homes were just queuing up to come on the market prior to the outbreak. Mortgage interest rates hit new lows in March (down about 1% from a year ago) bringing the typical monthly payment down significantly. For reference, a 1% change in interest rate equates to about a 10% change in buying power (i.e. an $800,000 home at 3.4% costs about the same per month as a $720,000 home at 4.4% interest).
Click or scroll down to find your area report:
Seattle | Eastside | Mercer Island | Condos | Waterfront
SEATTLE
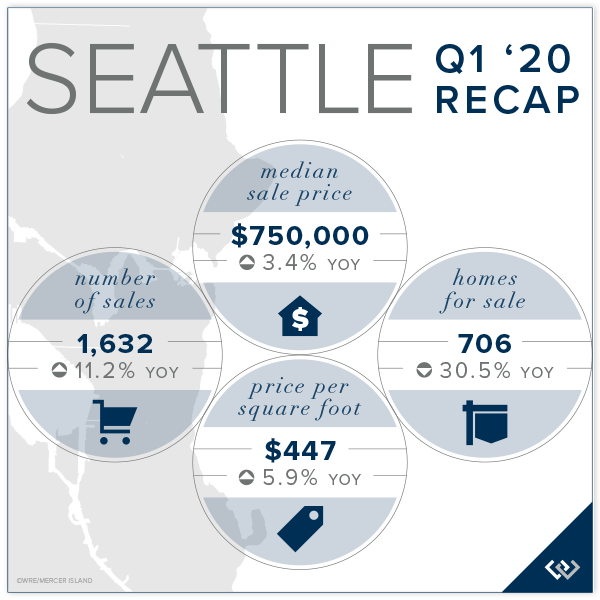
There were 11.2% more Seattle home sales in Q1 2020 (1,632) compared to Q1 2019 (1,468). Seattle’s median sale price increased by an average of 3.4% in 2019 to $750,000. Lake Forest Park (+8.0%) and Queen Anne-Magnolia (+7.0%) were the area’s top performers. The Central Seattle was down 6.9% over Q1 2019, much of which can be attributed to fewer luxury market sales and a higher percentage of smaller homes transacting during that period.
In Q1, 68.0% of Seattle homes (all price points) sold at or above their listed price, while only 13.7% of homes priced above $1 million did so. The average number of days to sell decreased to 41 from 50 in Q1 of the year prior.
The highest Seattle home sale was a 1930-built Lake Forest Park waterfront home for $5,000,000 and the lowest was a 1955-built 2-bedroom Skyway home for $215,000.
Click here to view the complete report for a neighborhood by neighborhood breakdown of Average Sale Price, size, and number of homes sold.

EASTSIDE
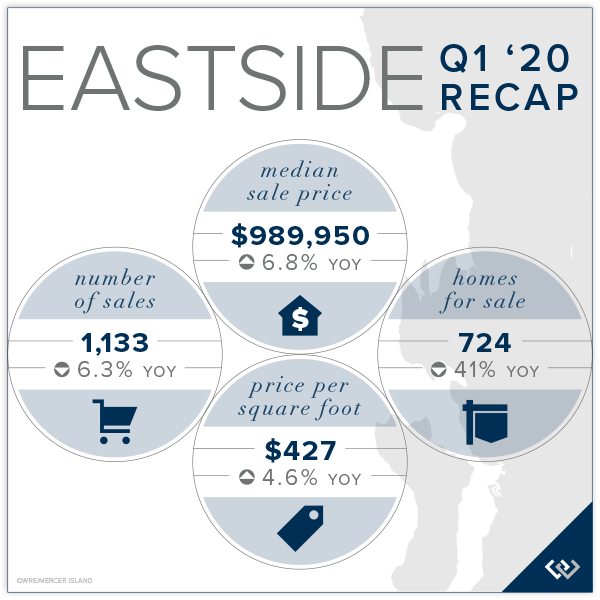
In Q1, 64.6% of Eastside homes, and 28.6% of homes priced above one million dollars, sold for at or above their listed price.
The Eastside median sale price was $989,500 in Q1, up 6.8% over Q1 2019. South Eastside (+18.1%) and Kirkland (+14.1%) performed best, while Woodinville saw a 2.5% decrease in its median sale price. The highest sale was an $11.5 million Medina waterfront home and the lowest sale was a 1960’s Lake Margaret area cottage.
Click here for the full report and neighborhood-by-neighborhood statistics!

MERCER ISLAND
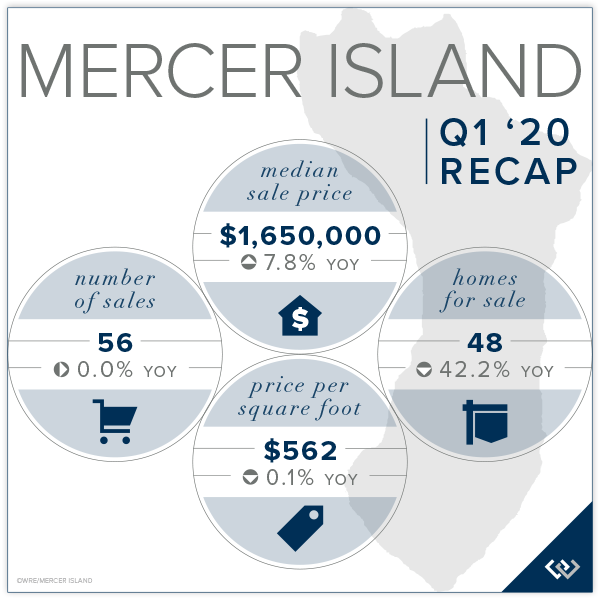
Mercer Island has seen a record shortage of homes on the market in Q1 with the lack of homes for sale dominating conversations between buyers and their brokers. There were 56 home sales in the first quarter, with only 6 homes sold below $1 million and 19 with sale prices above $2 million.
In Q1, 48.2% of all homes, and 12.5% of homes priced above two million dollars, sold for at or above their listed price. The highest Mercer Island sale was a $4.8 million waterfront home on the north-eastern tip of the Island. The lowest was a $815,000 renovation/rebuild ready rambler on West Mercer Way.
Click here to view the complete report for a neighborhood by neighborhood breakdown of Average Sale Price, size, and number of homes sold.
CONDOS – SEATTLE & EASTSIDE
Seattle’s condo median sale price was the same in Q1 2020 as in Q 1 2019 ($460,000) with 605 units transacting. The North Seattle (+28.3%) and Richmond Beach-Shoreline (+18.4%) outperformed the region while West Seattle condos were down 5.0% over Q1 of the prior year. In Q1, 53.7% of Seattle condos (all prices), and 3.1% of condos priced above one million dollars, sold for at or above their listed price.
On the Eastside, the median sale price was up 6.5% to $490,000. Woodinville (+21.4%) and Redmond (+17.2%) condos outpaced those in surrounding cities while East Bellevue condos sold for 23.2% less than in Q1 2019. There were 528 units sold on the Eastside this quarter.
In Q1, 67.4% of all Eastside condos, and 4.2% of those priced above one million dollars, sold for at or above their listed price.
Check out all of these factoids and more in the full condo report.

WATERFRONT
The pace of waterfront transactions has been slowing over the past few quarters, driven in large part by fewer international buyers in the market. Even so, Q1 was markedly off for waterfront sales. The Eastside had 3 private waterfront home sales. Seattle had 8, Mercer Island had 2, and Lake Sammamish had no sales in the first three months on 2020.
The highest private waterfront sale in Q1 was on Lake Washington in Medina at $11.5 million. The most affordable waterfront sale was a $1.5 million Beach Drive West Seattle home with 22 feet of waterfront on Puget Sound. Note this report includes privately-owned, rather than shared, waterfront transactions only.
This top-level overview of the entire Seattle-Eastside private waterfront market, including Mercer Island and Lake Sammamish, provides a glance into the trends occurring in our region over time. Interesting, and certainly insightful, it in no way replaces an in-depth analysis on waterfront value provided by a savvy broker with years of local waterfront experience.
Find a Home | Sell Your Home | Property Research
Neighborhoods | Market Reports | Our Team
We earn the trust and loyalty of our brokers and clients by doing real estate exceptionally well. The leader in our market, we deliver client-focused service in an authentic, collaborative and transparent manner and with the unmatched knowledge and expertise that comes from decades of experience.
2737 77th Ave SE, Mercer Island, WA 98040 | (206) 232-0446 mercerisland@windermere.com
© Copyright 2020, Windermere Real Estate/Mercer Island. Information and statistics derived from Northwest Multiple Listing Service and deemed accurate but not guaranteed.
Economic Insights from Matthew Gardner


As we all hunker down through these challenging times, it is comforting to remember that there will be light at the end of the tunnel.
A voice of calm and reason in this time of uncertainty has been our Windermere Chief Economist, Matthew Gardner. While he is expecting an economic slowdown accompanied by a temporary 15-20% reduction in the number of homes sold, he believes the housing market will bounce back once we find our new normal.
Click here to watch his latest videos, or scroll down for some key takeaways…
The US economy will contract sharply but should perk up by Q4.
We’re in for a rough few quarters as the economy enters a recession. Just how rough—and how long—is still under debate. What economists do agree on is that the 4th quarter is looking remarkably positive…assuming we get through the COVID-19 crisis and the economy can resume somewhat normal activity before the fall.

Housing prices will likely remain stable.
Seattle home prices should remain steady—or even rise slowly as we come out of the recession—for a few reasons:
- DIVERSE INDUSTRIES IN OUR AREA which allow us to better weather the economic storm.
- SOLID FINANCIAL FOOTING as one third of local home owners have 50% or greater equity in their homes.
- STRONG DEMAND with more buyers than homes available, as well as rock-bottom interest rates.

This will be different than 2008…
We’re experiencing a health crisis, not a housing crisis.
- WE’LL SEE A PAUSE, NOT A COLLAPSE. Unlike last time, the housing market was strong going into this crisis and should rebound quickly. Why? Because this recession will be due to specific external factors rather than any fundamental problem with the housing market.
- FORECLOSURES WILL BE FEWER with most lenders offering relief to homeowners in distress due to temporary employment issues. Unlike 2008’s mortgage crisis caused by lax lending standards and low down payments, today’s home owners are better qualified and have more equity in their homes.

Find a Home | Sell Your Home | Property Research
Neighborhoods | Market Reports | Our Team
We earn the trust and loyalty of our brokers and clients by doing real estate exceptionally well. The leader in our market, we deliver client-focused service in an authentic, collaborative and transparent manner and with the unmatched knowledge and expertise that comes from decades of experience.
2737 77th Ave SE, Mercer Island, WA 98040 | (206) 232-0446
© Copyright 2020, Windermere Real Estate / Mercer Island
Annual Seattle-Eastside Real Estate Report: A Look Back at 2019


A strong local employment sector, very low mortgage interest rates, and the most balanced market we’ve seen in two decades each contributed to increased sales velocity in 2019.
While the number of homes for sale increased overall in 2019 as compared to 2018, the higher rate of sales throughout the year resulted in nearly a third fewer homes on the market at year-end in 2019 than at the end of 2018. The inventory of homes available to purchase in 2020 will be a dominating factor in the local real estate market in the coming year.
Click or scroll down to find your area report:
Seattle | Eastside | Mercer Island | Condos | Waterfront
SEATTLE
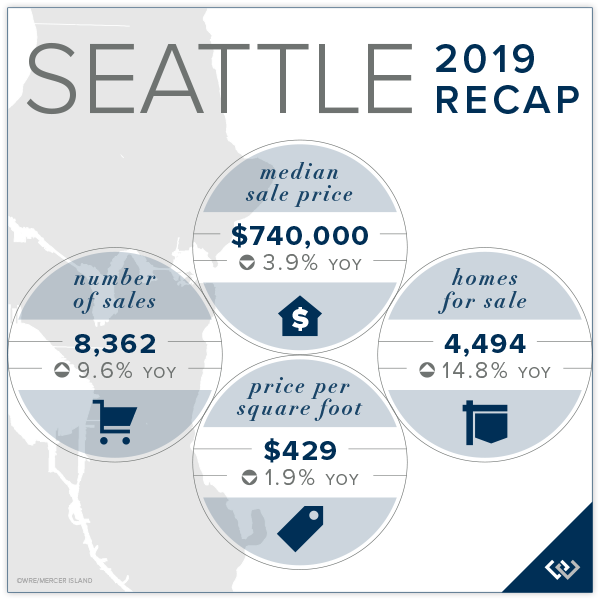
There were 9.6% more Seattle home sales in 2019 (a total of 8,362), bringing Seattle back to its typical annual sales velocity following an off year in 2018. Seattle’s median sale price softened by 3.9% in 2019, with the Central Seattle region performing best (-1.6%) and the Ballard-Green Lake region down the most (-4.6%). In the north end of Seattle, Lake Forest Park-Kenmore and Richmond Beach-Shoreline showed the strongest five-year growth trend at 47.1% and 45.5% respectively.
In 2019, 53.9% of all Seattle homes sold at or above their listed price. The average number of days to sell jumped notably to 36 from 22 the year prior, indicating movement towards a more balanced market. The upper price segments of the market were far less competitive with just 10.4% of homes sold above one million dollars transacting at or above their list price.
The highest Seattle home sale was in Washington Park (Central Seattle) for $13,750,000 and the lowest was a Lake Union houseboat for $80,000.
Click here to view the complete report for a neighborhood by neighborhood breakdown of Average Sale Price, size, and number of homes sold.

EASTSIDE
On the Eastside, neighborhoods central to core employment hubs continue to see older, more affordable housing stock replaced with new and more expensive development. On the periphery, reasonably priced homes are highly competitive as homebuyers and investors alike scramble for homes that offer greater appreciation potential.
Development in East Bellevue, particularly surrounding the Spring District, is predicted to significantly drive prices upward in the coming years as employment centers expand and light rail service to Seattle begins.
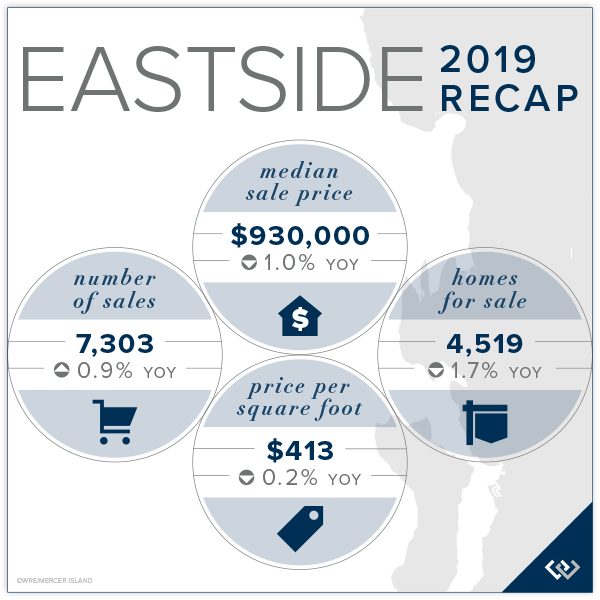
In 2019, 49.7% of all homes, and 18.8% of homes priced above one million dollars, sold for at or above their listed price.
Median sale prices in Eastside cities fared better than those in Seattle, with the overall Eastside median sale price down 1.0% from 2018. Kirkland performed best on the Eastside with a median sale price gain of 3.8% to $1,350,000. Looking at the five-year trend, Kirkland came in on top with a 67.1% increase in its median sale price over the past five years, followed by Juanita-Woodinville-Duvall at 48.0%, and East Bellevue at 44.5%.
Click here for the full report and neighborhood-by-neighborhood statistics!

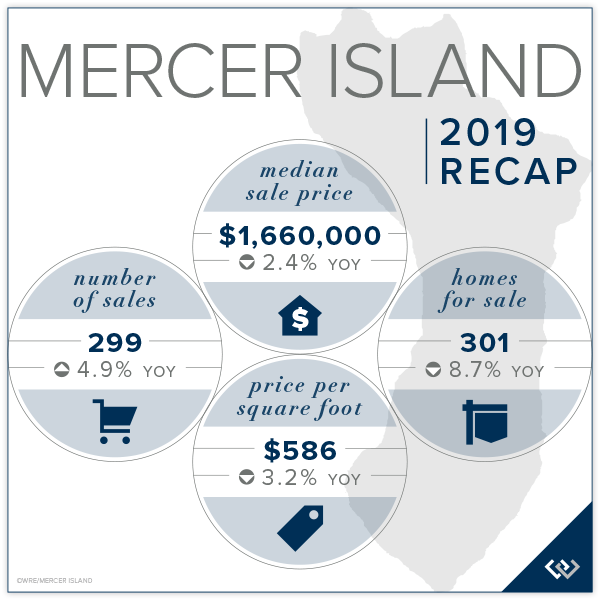
MERCER ISLAND
Mercer Island, central to the Seattle-Eastside region, held the middle ground with prices softening slightly—not as much as in Seattle, but more than on the Eastside.
A total of 299 homes changed hands in 2019 according to Northwest Multiple Listing Service. The highest Mercer Island sale was a $10,050,000 waterfront home on the North End. The lowest was a $685,000 renovation/rebuild ready rambler on West Mercer Way.
In 2019, 39.8% of all homes, and 12.7% of homes priced above two million dollars, sold for at or above their listed price.
Well-priced homes in move-in ready condition, with good lighting and access, and with functional floor plans, command the most attention from market-savvy buyers hoping to make a good investment in the place they will call home.
Click here to view the complete report for a neighborhood by neighborhood breakdown of Average Sale Price, size, and number of homes sold.

CONDOS – SEATTLE & EASTSIDE
The Seattle and Eastside condo markets could not be more different. Seattle has seen the number of available units increase significantly while the Eastside has suffered from a lack of inventory.
Seattle’s overall condo median sale price declined by 9.3% in 2019 to $458,500. The Ballard-Green Lake market was down the most (-16.4%) while Lake Forest Park-Kenmore was the only market not in the red (up 3.3%). In 2019, 45.9% of all Seattle condos, and 2.9% of condos priced above one million dollars, sold for at or above their listed price.
On the Eastside, the median sale price was down 2.4% overall to $469,000. The communities south of I-90 did quite well with a 9.0% increase over 2018. Redmond fared worst with a 15.3% decline in its median sale price. In 2019, 49.3% of all Eastside condos, and 2.7% of condos priced above one million dollars, sold for at or above their listed price.
Check out all of these factoids and more in the full condo report.

WATERFRONT
The Eastside had 42 private waterfront home sales in 2019. Seattle had 41, Mercer Island had 20, and Lake Sammamish had 31 sales during the same period.
The highest Eastside—and regional—private waterfront sale of 2019 was on Hunts Point for $37,500,000. The highest 2019 sales in the surrounding areas include a Washington Park (Seattle) home at $13,750.000, a north end Mercer Island property at $10,050,000, and a $5,750,000 home on the west side of Lake Sammamish.
This top-level overview of the entire Seattle-Eastside private waterfront market, including Mercer Island and Lake Sammamish, provides a glance into the trends occurring in our region over time. Interesting, and certainly insightful, it in no way replaces an in-depth analysis on waterfront value provided by a savvy broker with years of local waterfront experience.

ABOUT WINDERMERE MERCER ISLAND
We earn the trust and loyalty of our brokers and clients by doing real estate exceptionally well. The leader in our market, we deliver client-focused service in an authentic, collaborative and transparent manner and with the unmatched knowledge and expertise that comes from decades of experience.

© Copyright 2020, Windermere Real Estate/Mercer Island. Information and statistics derived from Northwest Multiple Listing Service and deemed accurate but not guaranteed.
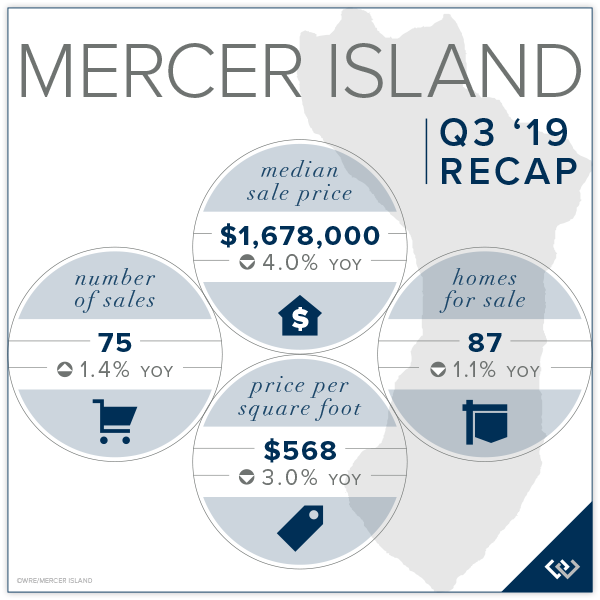
Q3 2019 Reports: Market Update


Q3 was the most stable and balanced market we have seen in years. With very low mortgage interest rates compelling buyers to act and fewer homes for sale than we saw last fall (when a flood of homes came to market), buyers and sellers are each finding their own place in a more equitable real estate arena.
Approximately 41% of homes for sale in Q3 sold at or above their listed price. This segment was on the market for an average of just seven days and included the most highly desired and well-priced properties in mainstream price points. Of the remaining homes for sale, just over one third underwent a price reduction before resulting in a sale. That number increased steadily as we moved deeper into Q3, ending the quarter with an average of 43% of listed homes with sales occurring following a price reduction.
From a home buyer’s perspective, the best properties sold quickly and at a premium. Of the homes that remained on the market, there was ample room for negotiation to a fair price. Q3 home sellers were generally more informed and more likely to price realistically from the start and adjust quickly if they were off target.
This more balanced market afforded many more consumers the ability to comfortably complete a sell/buy transaction and with enough time and space to thoroughly conduct due diligence on prospective properties.
Click or scroll down to find your area report:
Seattle | Eastside | Mercer Island | Condos | Waterfront
SEATTLE
The Seattle in-city real estate market slowed from a racetrack inferno to cruising speed over the past year and a half. Prices softened an average of 2% in Q3 with the Central Seattle region feeling the biggest impact (down 7.6% from Q3 2018). The Ballard-Green Lake region had the highest number of Q3 sales (582) while the Lake Forest Park-Kenmore area boasted the most affordable cost per home square foot ($340). When it comes to returns, Lake Forest Park-Kenmore, South Seattle, and Richmond Beach-Shoreline were nearly tied for the strongest five-year growth trend at 73.9%, 73.3% and 73.2% respectively.
Click here to view the complete report for a neighborhood by neighborhood breakdown of Average Sale Price, size, and number of homes sold.

EASTSIDE
Stimulated by announced expansion from the top names in tech, the Eastside is the place to be right now. Buyers found far fewer homes for sale—nearly 25% less—in Q3 than they did just one year ago. Sale prices in Kirkland, bolstered by recent announcements from Google and Tableau, were up an average of 15.4% over Q3 2018. Prices near the Microsoft campus, where the Spring District is coming online, where up 3.2%. The West Bellevue market saw a lower Median Sale Price which was attributable to fewer high-end sales in Q3 this year compared to last year. All in all, the Eastside had a very good quarter. Home sellers should be pleased with their returns and home buyers should feel good about purchasing in a robust market.
Click here for the full report and neighborhood-by-neighborhood statistics!

MERCER ISLAND
Mercer Island experienced continued slowing in the luxury market with fewer waterfront sales (5) than typical in Q3. Conversely, many moderately-priced renovation-ready homes transacted this quarter bringing the overall Q3 Median Sale Price down 4% to $1,678,000. The Island is finally beginning to see a moderate number of building and remodel applications submitted after a two-year lull sparked by major changes in the city’s residential building code. The North End had the highest average cost per square foot ($620) while Mercerdale ($435) was most affordable. First Hill had the shortest average market time with just 5 days and East Mercer had the longest (117 days). Demand remains steady and we expect well-priced, turnkey condition homes to continue to do quite well as we move further into the fall market.
Click here to view the complete report for a neighborhood by neighborhood breakdown of Average Sale Price, size, and number of homes sold.

CONDOS – SEATTLE & EASTSIDE
Competition from new and pre-sale buildings, aging structures, a larger percentage of affordable units transacting, and urban flight have contributed to the 12.3% Median Sale Price decline in Seattle to $438,500 (from $500,000 in Q3 2018). To be fair, the Five-Year Median Price Trend shows prices up 71.9% since Q3 2014, giving most condo owners a nice cushion to fall back on.
The Median Sale Price was down 1.9% on the Eastside to $471,000 from $480,000. An extremely low number of resale units for sale, coupled with many of the same attributes impacting the Seattle condo market, contributed to the slight softening seen in the Eastside condo market.
Recent changes in Washington condo laws will eventually bring more condos and townhomes online in the next economic cycle, but potential buyers may have to wait 5-7 years to see that morph from concept to reality.
Check out all of these factoids and more in the full condo report.

WATERFRONT
Seattle had 13 private waterfront home sales in Q3, the highest of which was a $10.6 million Laurelhurst estate on a shy acre with 150 feet on the water. The Eastside (Bellevue-Kirkland) had nine sales in Q3, including a $15.4 million 1925-built Yarrow Point home on 1.15 acres with 100 feet along the water’s edge. Further east, Lake Sammamish had eleven waterfront sales in Q3 ranging from $2.0-4.5 million.
Centrally located to the Seattle-Bellevue metro areas, Mercer Island had five private waterfront sales ranging from a $10.1 million, 2002-built North End home with 124 feet of waterfront on one and a half acres to a $3.6 million, mid-century Eastside home with 85 feet on the water and just over half an acre.
This top-level overview of the entire Seattle-Eastside private waterfront market, including Mercer Island and Lake Sammamish, provides a glance into the trends occurring in our region over time. Interesting, and certainly insightful, it in no way replaces an in-depth analysis on waterfront value provided by a savvy broker with years of local waterfront experience.

ABOUT WINDERMERE MERCER ISLAND
We earn the trust and loyalty of our brokers and clients by doing real estate exceptionally well. The leader in our market, we deliver client-focused service in an authentic, collaborative and transparent manner and with the unmatched knowledge and expertise that comes from decades of experience.
© Copyright 2019, Windermere Real Estate/Mercer Island. Information and statistics derived from Northwest Multiple Listing Service and deemed accurate but not guaranteed.