Facebook
 X
X
 Pinterest
 Copy Link
How’s the Market? Q2 Real Estate Review

While Seattle and the Eastside are still considered a seller’s market, buyers experienced some much-needed relief in the second quarter with new listings outpacing the number of homes sold. Rising interest rates have initiated a shift toward a more balanced market. Opportunities abound for both sellers (who are still seeing higher sales prices than this time last year) and buyers (who finally have some breathing room to negotiate price and contingencies). We expect this shift to continue with a stabilization of home prices rather than the steep upward trajectory we saw last year.
Click or scroll down to find your area report:
Seattle | Eastside | Mercer Island | Condos | Waterfront
SEATTLE
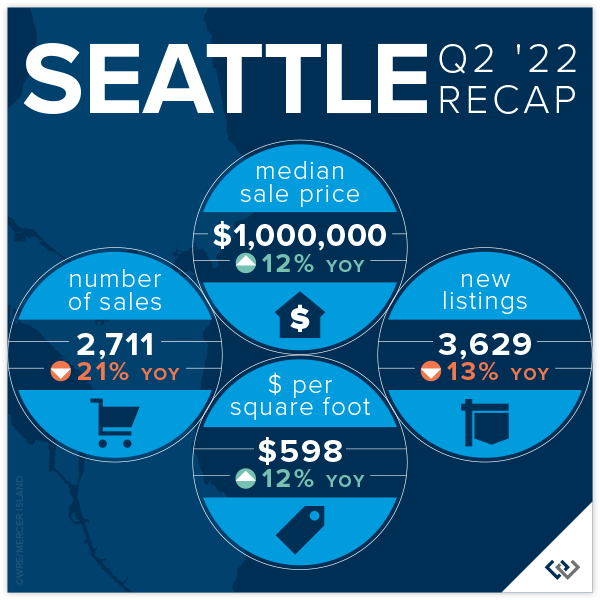
The Seattle real estate market for single family homes is holding steady despite rising interest rates and slowdowns elsewhere in King County! The median sale price is up 9% since the end of 2021 (from $910,000 to $1,000,000). Year over year, the median price rose from $895,000 in Q2 2021 to $1,000,000 in Q2 2022 (also roughly 12%).
Anecdotally, we believe that Seattle continues to gain ground because it remains affordable when compared to the cities and neighborhoods to the east. Eastside median prices rose so sharply over the last two years that it left Seattle “in the dust” as the market leader of the region. As we know, slow and steady wins the race, though there is no way to know yet if this particular race is a marathon or a sprint.
Interest rates nearly doubled in Q2, though that seems to leave Seattle home shoppers undeterred. 86% of the sales in Q2 sold in the first 10 days at an average of 110% of list price.
Click here for the full report and neighborhood-by-neighborhood statistics!

EASTSIDE
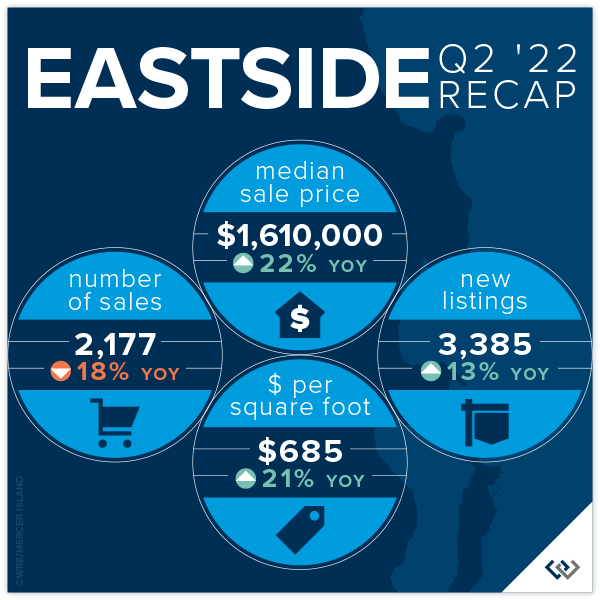
Relief has finally come to home shoppers on the Eastside! New listings are up 13% year over year. Further, there has been a slide in total number of sales, down 18% year over year. This means there are more choices for anyone who is in the market to buy a home. Price gains remain steady for now, up 22% over Q2 of 2021. This is likely riding the wave of growth in late 2021 and early 2022, but with the higher supply and lower demand this is may be a trend that tapers off in the near future.
Average price per square foot saw its first quarterly drop since Q2 of 2019, down from $713 in Q1 to $685. The overall median price fell from a high of $1,625,000 in Q1 to $1,610,000 in Q2. Even more exciting for home buyers is that (when in competition) the list to sales price ratio is 109%— down from 119% in Q1.
If you’ve thought about selling your home, it’s still a great time. When a home is prepared well and priced right shoppers pay attention. Of the 2177 homes sold in Q2, 84% of those sold in the first 10 days. This isn’t far off of the 90% that was posted in Q1. It is harder to get noticed today than in recent memory—this is where choosing a true professional to partner with is so important! Windermere brokers have their fingers on the pulse and know how to make you stand out in a crowd!
Click here for the full report and neighborhood-by-neighborhood statistics!

MERCER ISLAND
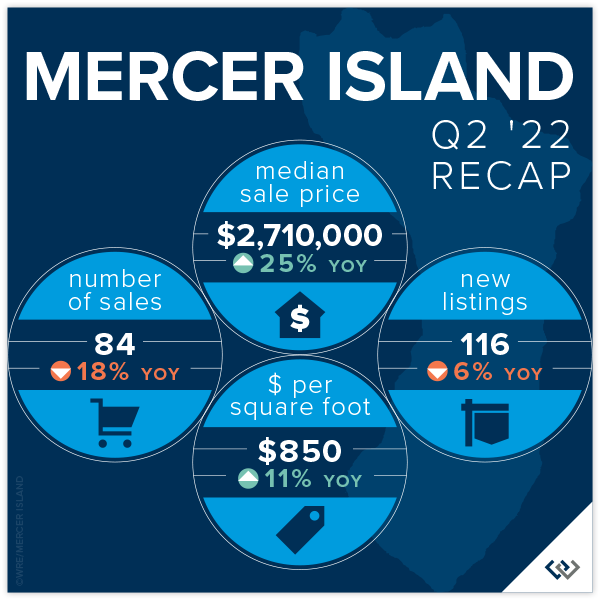
Mercer Island continues to be a fabulous place to be a homeowner. Median prices and price per square foot both saw increases over Q1 2022 numbers (6.5% and 5% respectively). Anecdotally, there has been a pace change. We don’t expect that to reflect in the stats until Q3, and even then the numbers are likely to be favorable as we gained so much ground in Q1 of this year.
The data that supports what we’re all feeling can be found in the relationship between number of new listings and number of homes sold. In Q2, there were 116 new listings and 84 sales compared to the same period in 2021 when we had 124 new listings and 102 sales. So, if you’re feeling like inventory is “up,” it’s not because more homeowners are deciding to sell but rather it appears that demand is down. Another way to look at this is that we sold 82% of the active inventory in spring of 2021 but only 72% in 2022. These are healthy numbers but it’s enough of a drop for us to feel it.
If you’re a buyer trying to break in to the Mercer Island market, it’s getting easier. 83% of the 116 new listings sold within the first 10 days for an average of 111% of the asking price. This is the most favorable these numbers have been since 2019. Working with a local pro will be your biggest advantage to determine which homes will sell at a premium and how to get the best deal!
Click here for the full report and neighborhood-by-neighborhood statistics!

CONDOS – SEATTLE & EASTSIDE
Condo average prices have seen their biggest quarterly rise since Q3 of 2016! As home shoppers adjust expectations amidst rising interest rates, the affordability offered by condos is an exciting place to turn. We are thrilled to see condos be a viable option as we recover from the pandemic and buyers return to more densely populated areas.
North Seattle (up 34%) and Capitol Hill (up 10%) are bright spots in the total number of condos sold year over year for Seattle. This makes perfect sense as both areas offer access to our growing light rail system and new retail opportunities that didn’t exist pre-pandemic. Seattle’s total sales year over year remained flat, literally zero, which means these two neighborhoods carried the entire city.
The same data point on the Eastside saw the entire area’s total number of sales fall 27% year over year. West Bellevue (down 51%) and Mercer Island (down 38%) topped the list. Meanwhile, prices on the Eastside are up an average of 20%.
Check out area-by-area details the full condo report.
WATERFRONT
Waterfront season is heating up. As expected, inventory is up from Q1 (32 total sales in Q2 v 17 in Q1), but what hasn’t changed is an average of only 6 listings for sale at any one time across all shorelines! Of all of the waterfront shorelines, Mercer Island boasted the lowest days on market with an average of just THREE days. Seattle had the highest days on market, with an average of 41 days.
The most affordable place to buy waterfront this quarter was Beach Dr in West Seattle at a closed sale price of $1,800,000 for 25’ of waterfront on a 17,000 sq. ft. lot. The largest piece of shoreline overall was 177 feet in Issaquah on Lake Sammamish, which commanded a sales price of $11,600,000.
This brief overview of the entire Seattle-Eastside private waterfront market, including Mercer Island and Lake Sammamish, illustrates the trends occurring in our region over time. This data is interesting and insightful but cannot replace an in-depth waterfront analysis provided by a savvy broker with years of local waterfront experience.

We earn the trust and loyalty of our brokers and clients by doing real estate exceptionally well. The leader in our market, we deliver client-focused service in an authentic, collaborative, and transparent manner and with the unmatched knowledge and expertise that comes from decades of experience.
© Copyright 2022, Windermere Real Estate/Mercer Island. Information and statistics derived from Northwest Multiple Listing Service and deemed accurate but not guaranteed.