Facebook
 Twitter
 Pinterest
 Copy Link
Property Tax Relief Programs in King County

More than 26,000 low-income seniors and disabled people in King County who qualify for a tax exemption haven’t claimed it…are you or your family member one of them?
If you are homeowner, make $58k or less per year, and are either age 61+ or retired due to disability, there is a good chance you qualify. You can even retroactively apply for the exemption for the prior 3 years!
Scroll down for details on this exemption plus 4 other property tax relief programs that King County offers.
In another county? Here is the full list of income thresholds for every county in Washington State, and here is another link to view the programs each county offers.
Senior/Disabled Property Tax Exemption

WHAT IS IT?
A reduction in King County property tax for seniors, people with disabilities, and disabled veterans.
WHO QUALIFIES?
- Seniors age 61+
or
- Those who cannot work due to a disability
or
- Veterans with service-related disabilities
YOU MUST…
- Own your home
- Have occupied it as a primary residence at least 6 months out of the year
INCOME LIMIT
- $58,423 maximum annual household income in the previous year
WAYS TO APPLY
- Click here to apply online
- Call 206-296-3920
- Ask your local senior center if they help with applications
Senior/Disabled Property Tax Deferral

WHAT IS IT?
The ability for seniors & disabled people to defer unpaid property tax/special assessments, including back taxes for as long as you’ve owned the home. Deferred taxes + any accumulated interest then become a lien on the property until it’s repaid.
WHO QUALIFIES?
- Seniors age 60+
or
- Those who cannot work due to a physical disability
YOU MUST…
- Own your home and have lived in it for more than 9 months in a calendar year
- Meet an equity requirement
INCOME LIMIT
- $67,411 maximum annual household disposable income
HOW TO APPLY
- Call 206-263-2338
MORE TAX RELIEF PROGRAMS…
Limited Income Deferral

WHAT IS IT?
The ability to defer the second installment of your property taxes/special assessments (normally due October 31st) if you are a low-income homeowner. The deferred taxes plus interest become a lien on the property until they’re repaid.
YOU MUST…
- Have owned your property for 5 years
- Be living in the home as of January 1st of the application year AND more than 9 months during that year
- Meet an equity retirement
- Have already paid the first half of your taxes (due April 30th)
INCOME LIMIT
- $57,000 maximum annual household income in the previous year
HOW TO APPLY
- Call 206-263-2338
Homeowner Improvement Exemption
WHAT IS IT?
Relief from tax increases caused by major additions or remodels.
YOU MUST…
- Own a detached single family dwelling (including mobile homes)
- File your claim for exemption with the assessor BEFORE construction is complete
HOW TO APPLY
- Call 206-263-2338
Flood & Storm Damage Property Tax Reduction

WHAT IS IT?
Tax relief for property damaged by something beyond the owner’s control. Eligible properties receive a reduction of assessed value resulting in lower property taxes. In addition, taxpayers can receive an exemption to keep taxes lower for the 3 years after they rebuild.
YOU MUST…
- Have your property on the assessment roll as of January 1st in the year it was damaged
- Have property that was destroyed, OR was in a declared disaster area and reduced in value by more than 20% as a result of the disaster
HOW TO APPLY
- Complete a Destroyed Property Claim Form and file it with King County Dept of Assessments within 3 years of the damaging event
- Call 206-263-2332 with questions
For more information on any of these programs, visit the King County Assessor’s tax relief page. You can also find info for other counties on the WA Dept of Revenue website.

© Copyright 2023, Windermere Real Estate/Mercer Island.
How’s the Market? Annual Review of Seattle Area Real Estate
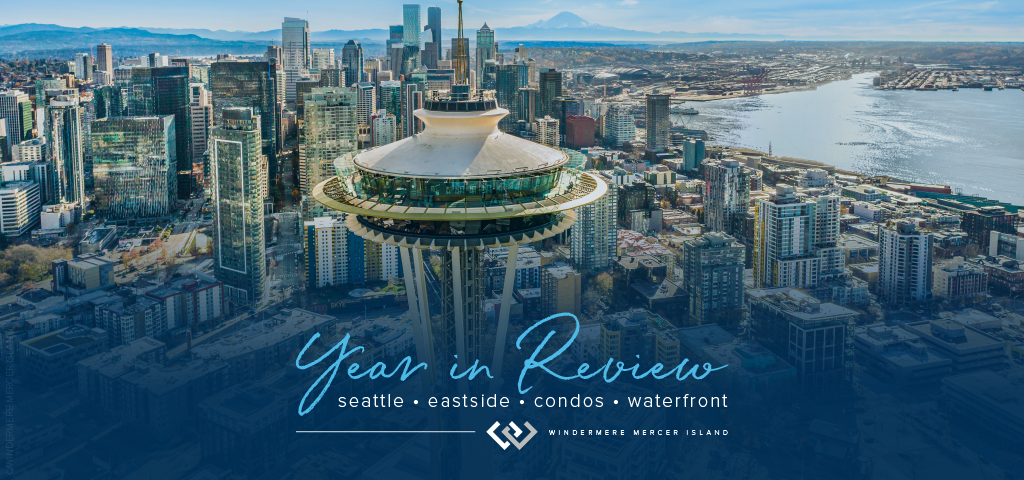
While 2022 began on the heels of an extreme seller’s market we saw in the wake of the COVID pandemic, the second half of the year showed a marked shift back toward normalcy. Rising interest rates and tech layoffs significantly slowed down the number of home sales. The good news for buyers is that we finally saw a rise in the number of homes for sale (although we’re still not back up to our pre-pandemic inventory level).
Our Chief Economist, Matthew Gardner, predicts that median home prices will continue to pull back from their 2022 spike, but will then resume a more normal level of appreciation once interest rates stabilize. You can find his full forecast here.
Click or scroll down to find your area report:
Seattle | Eastside | Mercer Island | Condos | Waterfront
SEATTLE
The Seattle real estate market seems to be out to prove the old “tortoise and the hare” fable. The tale the numbers are telling is that when you don’t boom big, you’re likely not to bust big. 2022 was a year of steady growth and a lot less fear than in surrounding cities.
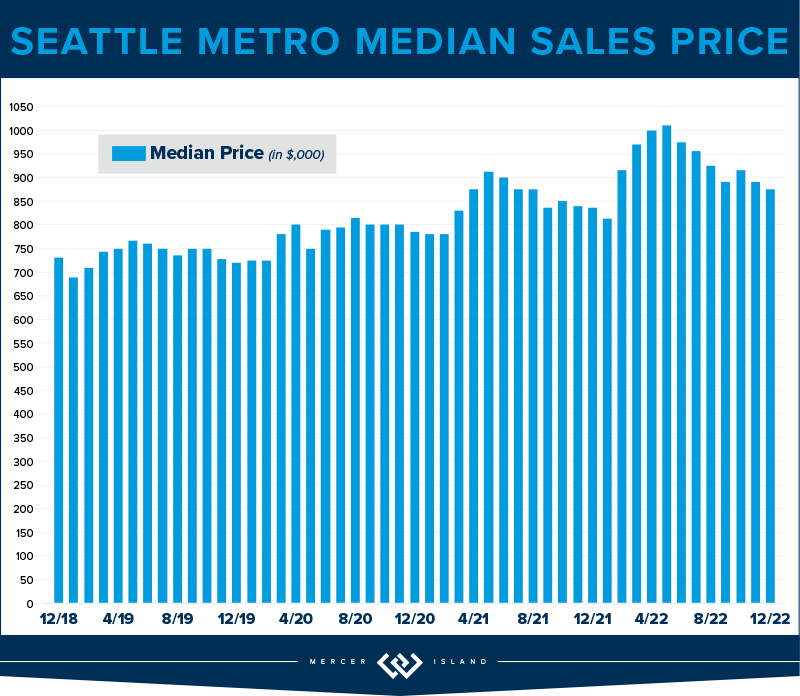
On average in a 2022 total look back, Seattle’s median price was up 10% (to $940,000) over $852,000 in 2021. Most of this gain was realized in the first half of the year, and unfortunately eroded in the second half of the year—when combined, it paints a fairly clear picture that we’re back to a “normal” market coming into 2023.
Queen Anne-Magnolia (up 17%), West Seattle (up 14%) and the Central District (up 13%) all fared better than average. Kenmore hung in at a 6% gain, which, given the volatility of interest rates and speculation, is still a respectable number for the year!
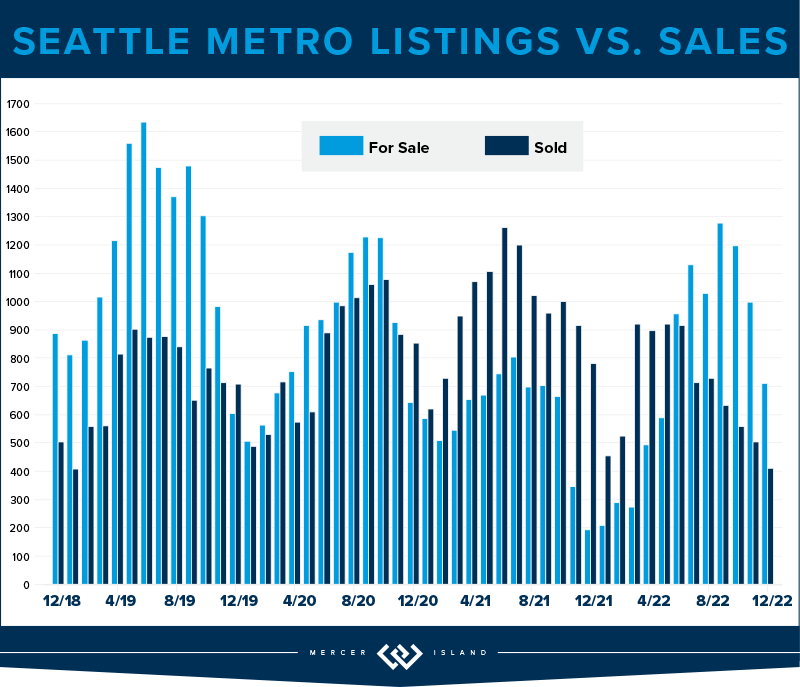
The headline for this year is that overall transaction volume was down in a big way. In Seattle, there were a total of 8,173 homes that sold; this is down 30% from the 11,670 sales we saw the year before. The slower market is not, however, creating a climate of fear where homeowners jump to cash out at the peak. New listings for the year were down a total of 13%.
We’ll be watching closely in 2023. If consumer confidence builds with the stabilization of interest rates, we’re going to have an even larger inventory crisis than we’ve faced in years past.
Click here for the full report and neighborhood-by-neighborhood statistics!
EASTSIDE
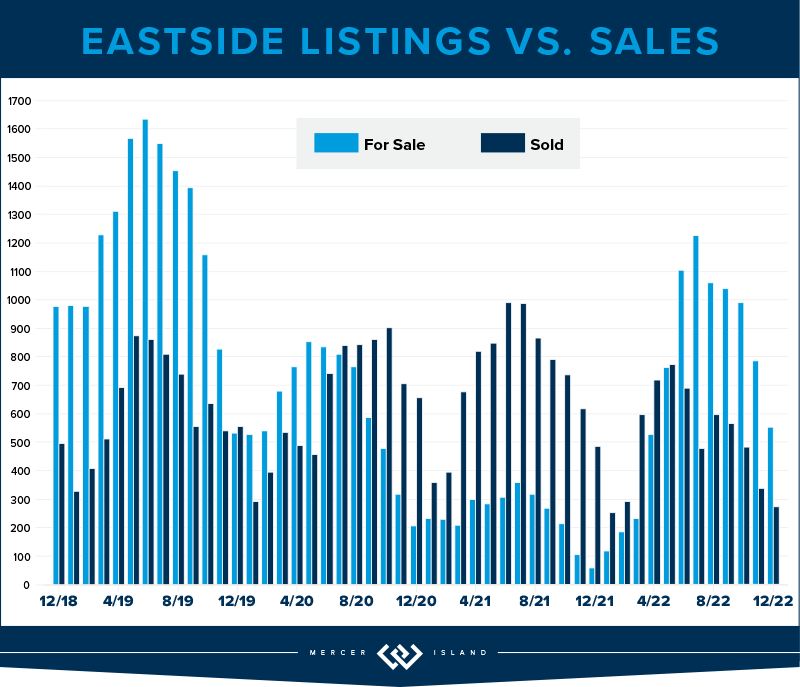
Finally, it’s safe to say that balance and normalcy have returned to the Eastside real estate market. The irony is: now that we’re in a balanced market, which is what homebuyers have purported to crave for a long time, the buyer’s appetite to purchase has all but dried up; overall transaction volume was down 36% in 2022 (5,448 sales vs. 8,569 in 2021).
If any of you are considering a move in the next 5 years, NOW is the time. The pendulum has swung back in the buyer’s favor: home inspections, negotiations and contingencies are all prevalent. We may not be at the exact “bottom” of pricing, but interest rates have stabilized, there are good homes for sale, and competition amongst buyers is rare. This is IT!
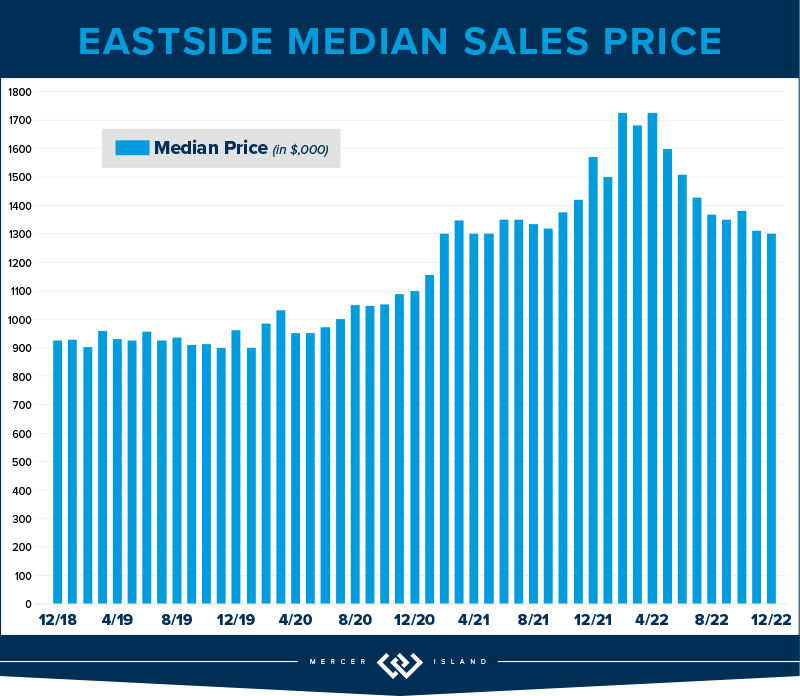
The Eastside’s Median Sale Price was $1,525,000 in 2022, up 14% over 2021’s unbelievable 30%+ gain ($1,350,000). Woodinville rules the day at a 17% rise, followed closely by Mercer Island (+16%) and Bellevue (both East and West at +15%).
While the market is slower paced, we are not in dire straits. This is thanks to a continued lack of inventory (down 5% YOY), and the amount of equity built in 2020 and 2021. Home sellers will spend the year working to determine the best way to attract a buyer. Price, preparation and timing will all play an important role. Home shoppers are sure to revel in their day in the sun!
Click here for the full report and neighborhood-by-neighborhood statistics!
MERCER ISLAND
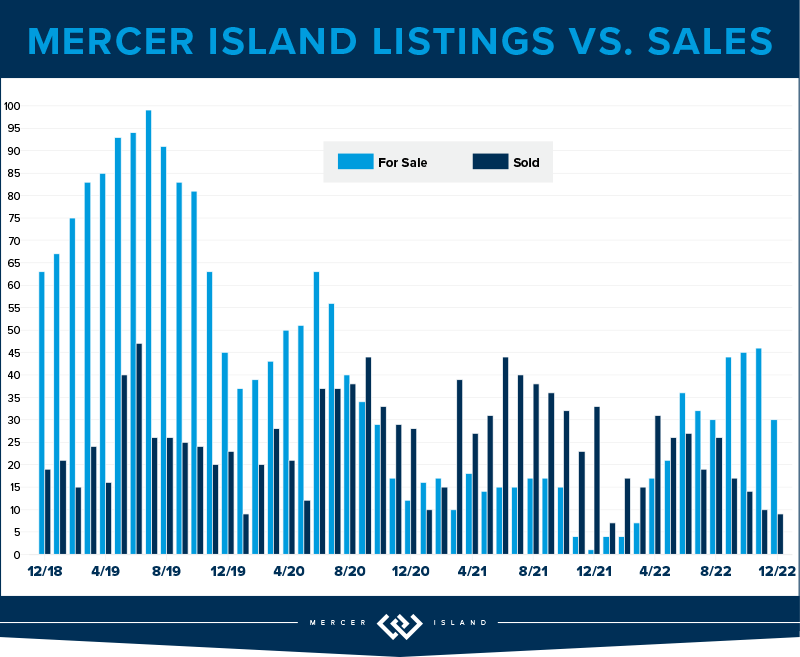
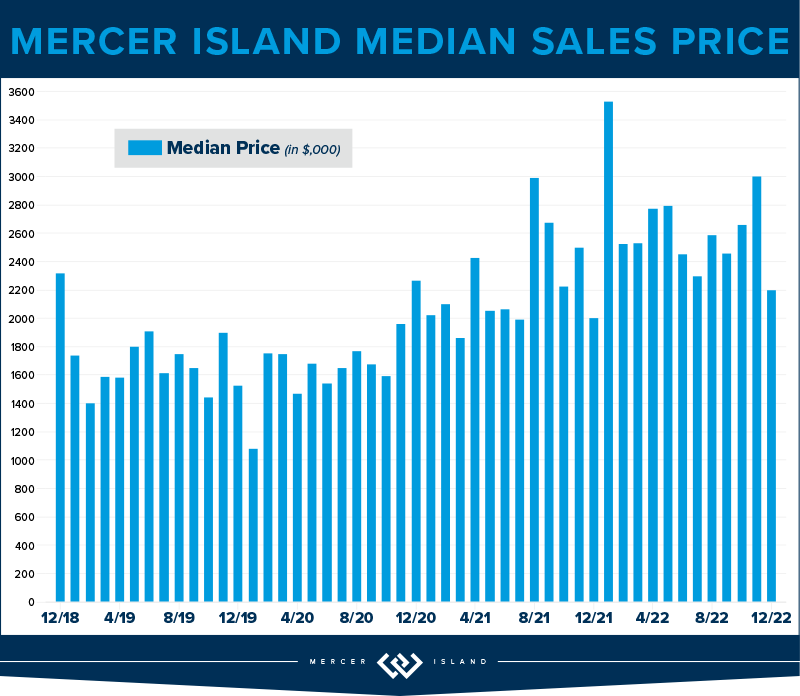
Mercer Island was once again its own unique micro-market within the Pacific Northwest. Total sales volume was only 209 homes, down 46% from 2021. This means that of nearly 10,000 households on the Island, only 2% purchased/sold a home.
The pace of sales was affected not only by interest rate volatility but also by the local tech economy/job market. The median home price nevertheless held strong with a 16% rise over 2021, even with the price correction that we all started to feel mid-year.
Buyers have decided to sit on the sidelines while it all shakes out, but home-owners on Mercer Island are not running for the hills. They’re patiently waiting (often without adjusting their asking prices) for the demand to return. It seems to be working: the median list price to median sales price ratio ROSE in 2022 from 77% to 88%.
2023 should be a solid year for Mercer Island real estate. All the pieces are in place: community pride, great schools and easy transportation. Let’s see if the upward trend continues!
Click here for the full report and neighborhood-by-neighborhood statistics!
CONDOS – SEATTLE & EASTSIDE
Seattle condos saw a Median Sale Price increase of 6% (to $520,000) and Eastside condos saw a 13% increase (to $620,000) in 2022. 53% of Seattle condos and 67% of Eastside condos sold in the first ten days on the market. This growth is larger than what we saw in 2021, which hopefully is some good news to anyone thinking of selling a condo in 2023. It seems that demand for urban living may be returning.
66% of Seattle condos and 77% of Eastside condos sold at or above their listed price. Those listings that sold in the first 10 days on the market went for an average of 1% and 4% above their list price, respectively..
On the Seattle side, Shoreline and Lake Forest Park condos saw about a 20% increase—and on the Eastside, Sammamish and East Bellevue condos carried the day with 19% and 23% increases—in Median Sale Price.
Overall, condos get our award for “ones to watch.” They remain a bright spot in terms of affordability when compared to single family homes, especially on the Eastside. Compare the $620,000 median sale price of a condo to the $1,525,000 median home price and it’s clear condos are a great first rung of the property ladder that might get attention in 2023.
Check out area-by-area details the full condo report.
WATERFRONT
There were 93 privately-owned waterfront home sales in the greater Seattle-Eastside region in 2022 (Eastside-32; Seattle-36; Lake Sammamish-15; Mercer Island-10). This is down significantly from the banner year in 2021 when we saw a whopping 170 total sales.
This truly is a market with geographic limitations. With such a high volume of sales in 2021 and a relatively strong 2022, we expect 2023 to be more conservative. Our late-2022 market shift from an extreme seller’s market to a more balanced level of supply and demand coincided with the close of the waterfront selling season. This means pricing will be tricky this season as we explore uncharted waters. More than ever, real estate experts will be essential to analyze the data and consult their spidey-senses to find the price that will attract a buyer in this new normal.
This brief overview of the entire Seattle-Eastside private waterfront market, including Mercer Island and Lake Sammamish, illustrates the trends occurring in our region over time. This data is interesting and insightful but cannot replace an in-depth waterfront analysis with your trusted professional.
© Copyright 2023, Windermere Real Estate/Mercer Island. Information and statistics derived from Northwest Multiple Listing Service and Trendgraphix, and deemed accurate but not guaranteed.
How’s the Market? Q3 2022 Real Estate Review

While still considered a seller’s market, our July-September home sale activity signaled the return of some much-needed balance. Seattle and Eastside home prices still posted year-over-year gains in Q3, but rising interest rates markedly slowed the pace of both listings and sales. Houses also stayed on the market longer than we saw during the frenzy earlier this year—the average Seattle home took 17 days to sell, while Eastside homes averaged 25 days to sell. Buyers have a great opportunity to negotiate better terms now with an eye out to refinance when interest rates come down in the future.
Click or scroll down to find your area report:
Seattle | Eastside | Mercer Island | Condos | Waterfront
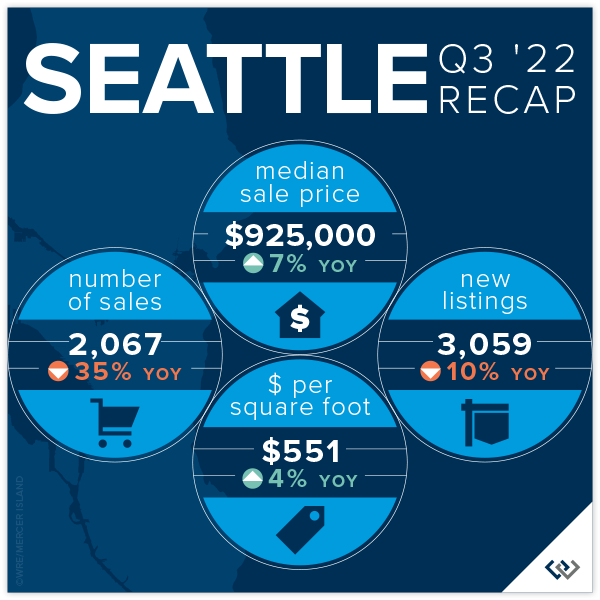
SEATTLE
There is a lot of good news in Seattle these days: Progress is being made in taking back downtown, the West Seattle Bridge is open AND real estate prices are UP year over year.
Transaction volume is down 35% across the city, which we can likely attribute to the volatility in interest rates, but listing volume is also down 10%. This is comforting! Supply and demand rules the market, and the last thing this balancing market needs is more inventory. We think this drop in seller enthusiasm is likely caused by the golden handcuffs of their historically low interest rates and refinance boom: even if your home isn’t meeting your needs these days, that 2.75% interest rate might be hard to give up.
Seattle’s average list/sold price ratio is 97%. This means if you listed your home for $1,000,000 you could expect to sell for $970,000 in Q3 of this year. Compare this with 82% on the Eastside. Seattle home sellers are more realistic and less affected by the price bloat of the last several years. We didn’t boom as hard, and we may not feel the impacts of a market balance as sharply either.
Click here for the full report and neighborhood-by-neighborhood statistics!
EASTSIDE
While we’re finally seeing the numbers reflect what the market has been feeling since May, it’s not as dire as one might think. Sales volume has slowed 38% year over year (based on total transaction count). However, new listings are also down (3%) which means the market reaching its peak has not sparked a sell off. This should keep our new normal buzzing along at pace similar to 2018 and 2019. Great homes that are priced right will sell—21% of homes sold above asking price and 40% of homes sold in the first 10 days.
Median list price is down 6% while median sales price is down 14.5%, which means homeowners looking to sell on the Eastside now have some data points to help them with realistic expectations of how to find the market. Average days on market is 25, which is higher than it’s been since Q1 of 2020! This is still slightly under the 6-year average. Don’t be tempted to think that there is something wrong with a home just because it has been on the market for a month; there are a lot of quality homes ready for their new owners.
The news of the day is interest rates. Heavy volatility in the markets and the administration’s drive to stem inflation have caused many buyers to pull out of the market. If you’re thinking you’ll wait for lower rates AND lower prices, you might be dreaming—if rates come down next year as predicted it will likely spur activity on. Our best advice: THIS is the market you’ve been waiting for. As a buyer you have choice, time and negotiating power for the first time since 2018. Capitalize! Then, refinance later.

Click here for the full report and neighborhood-by-neighborhood statistics!
MERCER ISLAND
Given the broader local news, we might expect doom and gloom from Q3 stats—this expert sees lots of opportunity and much needed stabilization after the crazy COVID boom. While median prices have fallen 1% year over year, the average price per square foot is actually UP. What does this mean? Comparing a median with an average is always a little tricky, but this likely points to a slowdown in the sale of larger homes.
To me, the better signs of market predictability are the months supply of inventory for the quarter (about 6 weeks for both condos and single family) and the average days on market (18 for sf and 57 for condo). These are all relatively healthy benchmarks, even though they’re markedly higher than in previous quarters. This is what’s causing media to report doom and gloom: inventory is up sharply (there was ONE active listing at the end of Q4 2021 vs 44 at the end of Q3 2022) and pending sales are down (57 vs. 94 last year in the same time period). When you compare our current numbers to any time period outside of the last two years, we’re faring very well!
The news of the day is interest rates. Heavy volatility in the markets and the administration’s drive to stem inflation have caused many buyers to pull out of the market. If you’re thinking you’ll wait for lower rates AND lower prices, you might be dreaming—if rates come down next year as predicted it will likely spur activity on. Our best advice: THIS is the market you’ve been waiting for. As a buyer you have choice, time and negotiating power for the first time since 2018. Capitalize! Then, refinance later.

Click here for the full report and neighborhood-by-neighborhood statistics!
CONDOS – SEATTLE & EASTSIDE
Condos remain the tortoise as opposed to the hare like residential markets of 2020-early 2022. Slow and steady will definitely win this race as the affordability of homeownership shrinks with rising interest rates. Looking at combined condo data (Eastside + Seattle), months supply of inventory is down to about 6 weeks from 2 months last quarter. Low months supply of inventory and low cumulative days on market (23) are two of the leading indicators of market health, and both are as low or lower as they’ve been in the recent past.
Condo prices are also holding strong with no change to the average $ per square foot in Seattle and an overall 5% rise in median sale price year over year. The Eastside tells an even slightly better story: a 9% rise in $ per square foot and a 6% rise in median sale price despite a 41% year-over-year drop in the number of transactions.
Keep rooting for the tortoise. This is a necessary niche in our marketplace. The first rung on the property ladder is condos again for the first time in a long time, and we really hope our Gen Z and Millennial buyers take the leap!
Check out area-by-area details the full condo report.
WATERFRONT
The most affordable place to buy waterfront this quarter was Beach Dr in West Seattle at a closed sale price of $1,800,000 for 22’ of waterfront on an 11,000 sq. ft. lot. The largest piece of shoreline overall was 172 feet in Medina on Lake Washington, which commanded a sales price of $17,800,000.
This brief overview of the entire Seattle-Eastside private waterfront market, including Mercer Island and Lake Sammamish, illustrates the trends occurring in our region over time. This data is interesting and insightful but cannot replace an in-depth waterfront analysis provided by a savvy broker with years of local waterfront experience.
We earn the trust and loyalty of our brokers and clients by doing real estate exceptionally well. The leader in our market, we deliver client-focused service in an authentic, collaborative, and transparent manner and with the unmatched knowledge and expertise that comes from decades of experience.
© Copyright 2022, Windermere Real Estate/Mercer Island. Information and statistics derived from Northwest Multiple Listing Service and deemed accurate but not guaranteed.
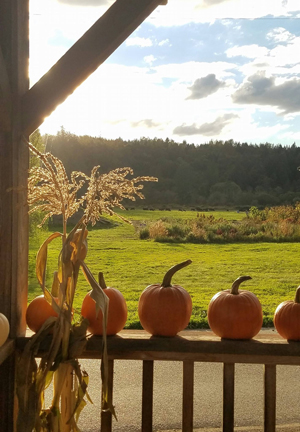
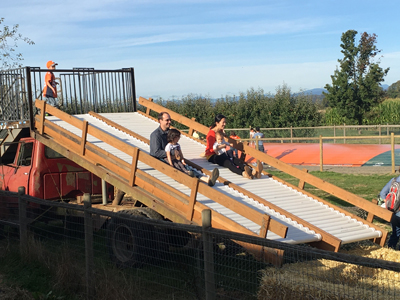
Favorite Local Pumpkin Patches

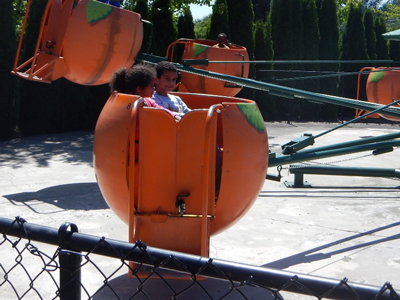
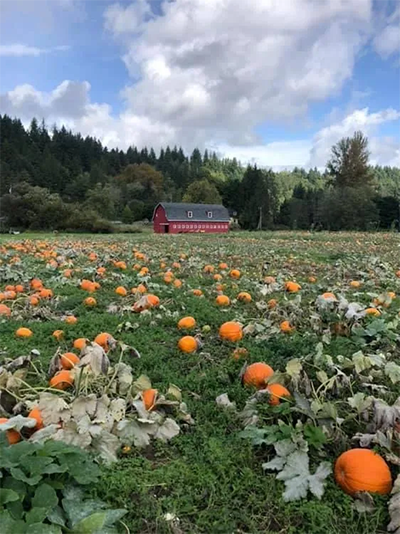
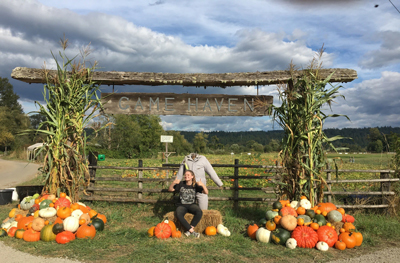
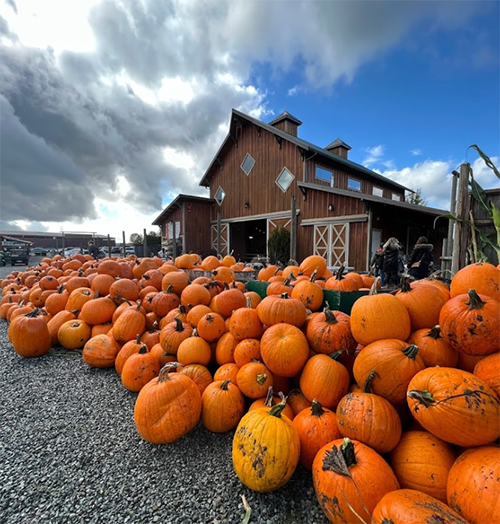
Grab your boots, pack a thermos…it’s time to choose those perfect Halloween pumpkins! This year, why not explore a new town and make your pumpkin patch experience a true adventure? All of these farms are open every weekend in October, and most are open on weekdays too. Some even welcome your furry family members on a leash. Scroll down for the full scoop!
Eastside | North of Seattle | South of Seattle
Eastside
Fletcher Farm
Dog-friendly with a scavenger hunt, farm animal zoo, storybook trail, mini-golf, photo stations, and junior corn maze for the little ones. End of season Halloween Bash, too!
18712 SE May Valley Road | Issaquah
fletcherfarmevents@gmail.com
fletcherfarmissaquah.com

Jubilee Farm
Hay rides, food trucks, music, hay maze, & hot apple cider.
229 W Snoqualmie River Rd NE | Carnation
(425) 222-4558
jubileefarm.org
Novelty Hill Farm
Dog-friendly! Corn maze, farm animals, trike track, & games.
26617 NE 124th Street | Duvall
(425) 788-2416
noveltyhillfarm.com

Oxbow Farm & Conservation Center
Live music, scavenger hunt, hay rides, mini pumpkin decoration, climbing tractor, conservation tours, & apple slingshot.
10819 Carnation-Duvall Rd. NE | Carnation
(425) 788-1134
oxbow.org/oxtober

Remlinger Farms
25 rides & attractions for children (including a train, carousel, & mini roller-coaster!), pony rides, apple cannon, restaurant, & new brewery with 20 choices on tap.
32610 NE 32nd Street | Carnation, WA
(425) 451-8740
remlingerfarms.com
Serres Farm
Mini train rides, corn maze and a dazzling variety of specialty pumpkins.
20306 NE 50th St | Redmond, WA
(425) 868-3017
serresfarm.com/pumpkin-patch
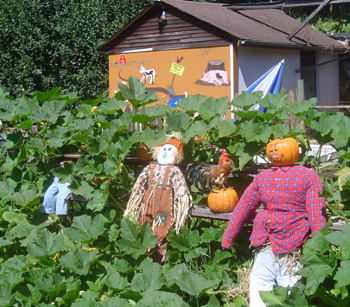
Two Brothers Pumpkins at Game Haven Farm
Baby calves and an eerie number of well-attired scarecrows.
7110 310th Avenue NE | Carnation, WA
(425) 333-4313
facebook.com/twobrotherspumpkins
North of Seattle
Bailey Vegetables
Kettle corn, cider, U-pick apples, baked goods, and kids play area with hay run, farm trikes & sandbox.
12691 Springhetti Rd | Snohomish
(360) 568-8826
baileyveg.com/pumpkin-patch

Bob’s Corn & Pumpkin Farm
12-acre corn maze, 2 kids’ mazes, play barn, hay rides, trike track, & apple cannon. Fire pit rentals for private groups, too!
10917 Elliott Road | Snohomish
(360) 668-2506
bobscorn.com/pumpkins

Carleton Farm
5-acre corn maze, playground, paintball gallery, apple guns, hay rides, & kids’ bucket train.
630 Sunnyside Blvd SE | Lake Stevens, WA
(425) 343-4963
carletonfarm.com/fall-fun
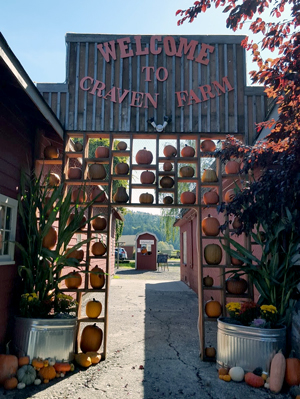
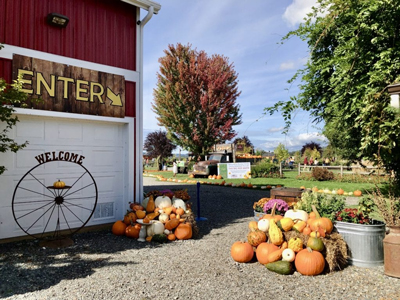
Craven Farm
15-acre corn maze, kids maze, farm animals, mini golf, cow train, foosball, espresso, cider donuts, & scarecrow making. Fire pit rentals and special dog-friendly days, too!
13817 Short School Road | Snohomish
(360) 568-2601
cravenfarm.com/fall-festival
Fairbank Animal & Pumpkin Farm
Lots of baby animals, “corn maize maze,” hay tunnel, toy duck races, photo boards, & veggie garden.
15308 52nd Ave W | Edmonds
(425) 743-3694
fairbankfarm.com
Stocker Farms
30+ attractions including a giant jumping pillow, tire mountain, epic play area, zip line, corn maze, pumpkin cannon, & more. The farm’s evil twin, Stalker Farms, comes out at night.
8705 Marsh Rd | Snohomish
(360) 568-7391
stockerfarms.com
Swans Trail Farms
Washington State corn maze, kids corn maze, petting farm, wagon rides, big slides, zip lines, u-pick apple orchard & live duck races.
7301 Rivershore Rd | Snohomish
(425) 330-3084
swanstrailfarms.com
South of Seattle
Carpinito Brothers Corn Maze & Pumpkin Patch
Rubber duck races, hay slides, corn pit, farm animals, hay maze, & corn maze.
Pumpkin Patch: 27508 W Valley Hwy N | Kent
Farm Fun Yard: 6720 S 277th St | Kent
(253) 854-5692
carpinito.com

Maris Farms
Racing pigs & ducks, mega slide, corn maze, jump pillow, animals, zip lines, rides, plus the creepy “Haunted Woods” complete with zombies and homicidal maniacs.
25001 Sumner-Buckley Highway | Buckley
(253) 862-2848
marisfarms.com

Mosby Farms
Dog-friendly! Corn maze and fresh farm market.
3104 SE Auburn-Black Diamond Rd | Auburn
(253) 405-0711
mosbyfarm.com/pumpkinpatch

Spooner Farms
Corn maze, pumpkin sling shot, speedway, farm animals, caramel apples, & roasted corn.
9710 State Route 162 East | Puyallup
(253) 840-2059
spoonerberries.com

Thomasson Family Farm
Laser tag, corn maze, play barn, farm animals, slides, duck races, trike track, apple slingshot, and giant Jenga & Connect 4.
38223 236th Avenue SE | Enumclaw
(360) 802-0503
thomassonfarm.com
We earn the trust and loyalty of our brokers and clients by doing real estate exceptionally well. The leader in our market, we deliver client-focused service in an authentic, collaborative, and transparent manner and with the unmatched knowledge and expertise that comes from decades of experience.
2737 77th Ave SE, Mercer Island, WA 98040 | (206) 232-0446
mercerisland@windermere.com
© Copyright 2022 Windermere Mercer Island
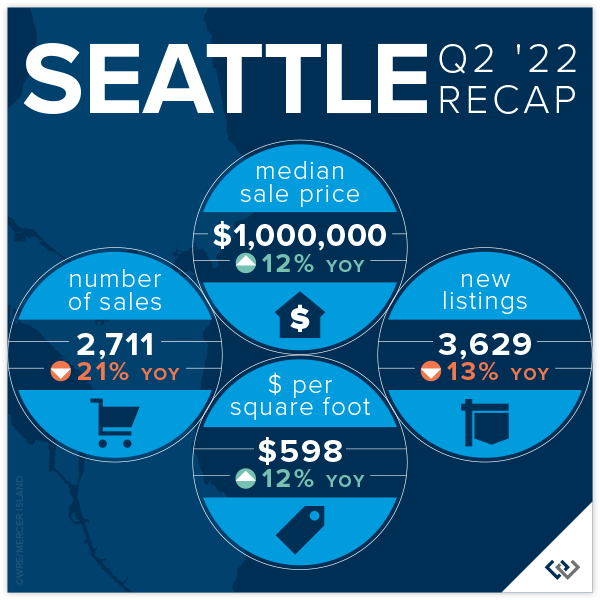
How’s the Market? Q2 Real Estate Review

While Seattle and the Eastside are still considered a seller’s market, buyers experienced some much-needed relief in the second quarter with new listings outpacing the number of homes sold. Rising interest rates have initiated a shift toward a more balanced market. Opportunities abound for both sellers (who are still seeing higher sales prices than this time last year) and buyers (who finally have some breathing room to negotiate price and contingencies). We expect this shift to continue with a stabilization of home prices rather than the steep upward trajectory we saw last year.
Click or scroll down to find your area report:
Seattle | Eastside | Mercer Island | Condos | Waterfront
SEATTLE
The Seattle real estate market for single family homes is holding steady despite rising interest rates and slowdowns elsewhere in King County! The median sale price is up 9% since the end of 2021 (from $910,000 to $1,000,000). Year over year, the median price rose from $895,000 in Q2 2021 to $1,000,000 in Q2 2022 (also roughly 12%).
Anecdotally, we believe that Seattle continues to gain ground because it remains affordable when compared to the cities and neighborhoods to the east. Eastside median prices rose so sharply over the last two years that it left Seattle “in the dust” as the market leader of the region. As we know, slow and steady wins the race, though there is no way to know yet if this particular race is a marathon or a sprint.
Interest rates nearly doubled in Q2, though that seems to leave Seattle home shoppers undeterred. 86% of the sales in Q2 sold in the first 10 days at an average of 110% of list price.
Click here for the full report and neighborhood-by-neighborhood statistics!
EASTSIDE
Relief has finally come to home shoppers on the Eastside! New listings are up 13% year over year. Further, there has been a slide in total number of sales, down 18% year over year. This means there are more choices for anyone who is in the market to buy a home. Price gains remain steady for now, up 22% over Q2 of 2021. This is likely riding the wave of growth in late 2021 and early 2022, but with the higher supply and lower demand this is may be a trend that tapers off in the near future.
Average price per square foot saw its first quarterly drop since Q2 of 2019, down from $713 in Q1 to $685. The overall median price fell from a high of $1,625,000 in Q1 to $1,610,000 in Q2. Even more exciting for home buyers is that (when in competition) the list to sales price ratio is 109%— down from 119% in Q1.
If you’ve thought about selling your home, it’s still a great time. When a home is prepared well and priced right shoppers pay attention. Of the 2177 homes sold in Q2, 84% of those sold in the first 10 days. This isn’t far off of the 90% that was posted in Q1. It is harder to get noticed today than in recent memory—this is where choosing a true professional to partner with is so important! Windermere brokers have their fingers on the pulse and know how to make you stand out in a crowd!

Click here for the full report and neighborhood-by-neighborhood statistics!

MERCER ISLAND
Mercer Island continues to be a fabulous place to be a homeowner. Median prices and price per square foot both saw increases over Q1 2022 numbers (6.5% and 5% respectively). Anecdotally, there has been a pace change. We don’t expect that to reflect in the stats until Q3, and even then the numbers are likely to be favorable as we gained so much ground in Q1 of this year.
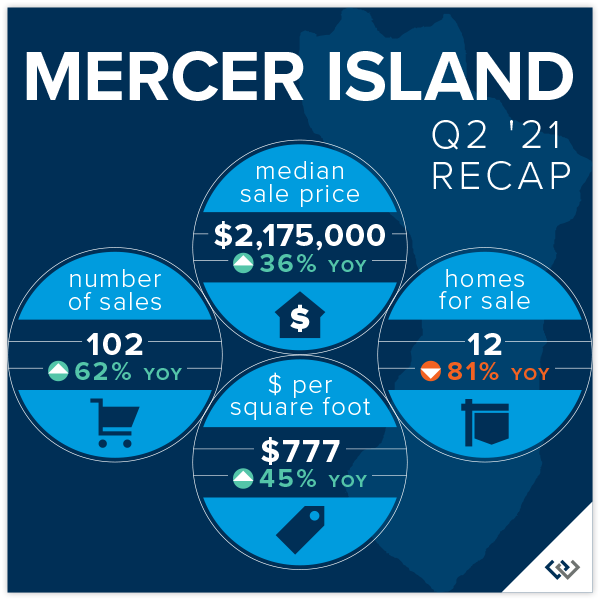
The data that supports what we’re all feeling can be found in the relationship between number of new listings and number of homes sold. In Q2, there were 116 new listings and 84 sales compared to the same period in 2021 when we had 124 new listings and 102 sales. So, if you’re feeling like inventory is “up,” it’s not because more homeowners are deciding to sell but rather it appears that demand is down. Another way to look at this is that we sold 82% of the active inventory in spring of 2021 but only 72% in 2022. These are healthy numbers but it’s enough of a drop for us to feel it.
If you’re a buyer trying to break in to the Mercer Island market, it’s getting easier. 83% of the 116 new listings sold within the first 10 days for an average of 111% of the asking price. This is the most favorable these numbers have been since 2019. Working with a local pro will be your biggest advantage to determine which homes will sell at a premium and how to get the best deal!

Click here for the full report and neighborhood-by-neighborhood statistics!
CONDOS – SEATTLE & EASTSIDE
Condo average prices have seen their biggest quarterly rise since Q3 of 2016! As home shoppers adjust expectations amidst rising interest rates, the affordability offered by condos is an exciting place to turn. We are thrilled to see condos be a viable option as we recover from the pandemic and buyers return to more densely populated areas.
North Seattle (up 34%) and Capitol Hill (up 10%) are bright spots in the total number of condos sold year over year for Seattle. This makes perfect sense as both areas offer access to our growing light rail system and new retail opportunities that didn’t exist pre-pandemic. Seattle’s total sales year over year remained flat, literally zero, which means these two neighborhoods carried the entire city.
The same data point on the Eastside saw the entire area’s total number of sales fall 27% year over year. West Bellevue (down 51%) and Mercer Island (down 38%) topped the list. Meanwhile, prices on the Eastside are up an average of 20%.
Check out area-by-area details the full condo report.
WATERFRONT
Waterfront season is heating up. As expected, inventory is up from Q1 (32 total sales in Q2 v 17 in Q1), but what hasn’t changed is an average of only 6 listings for sale at any one time across all shorelines! Of all of the waterfront shorelines, Mercer Island boasted the lowest days on market with an average of just THREE days. Seattle had the highest days on market, with an average of 41 days.
The most affordable place to buy waterfront this quarter was Beach Dr in West Seattle at a closed sale price of $1,800,000 for 25’ of waterfront on a 17,000 sq. ft. lot. The largest piece of shoreline overall was 177 feet in Issaquah on Lake Sammamish, which commanded a sales price of $11,600,000.
This brief overview of the entire Seattle-Eastside private waterfront market, including Mercer Island and Lake Sammamish, illustrates the trends occurring in our region over time. This data is interesting and insightful but cannot replace an in-depth waterfront analysis provided by a savvy broker with years of local waterfront experience.
We earn the trust and loyalty of our brokers and clients by doing real estate exceptionally well. The leader in our market, we deliver client-focused service in an authentic, collaborative, and transparent manner and with the unmatched knowledge and expertise that comes from decades of experience.
© Copyright 2022, Windermere Real Estate/Mercer Island. Information and statistics derived from Northwest Multiple Listing Service and deemed accurate but not guaranteed.
Seattle & Eastside Farmers Markets: Locations, Times & More

Summer is just around the corner, and so are these farmers markets! Spend an evening or weekend finding your new favorites among the tents. Think it’s all about kale? Think again. Most offer live entertainment along with a mouth-watering variety of local brews, cheese, bread, meat/seafood, honey, hand roasted coffee, and other hidden gems (in addition to the freshly picked fruits & veggies). This year, we’re proud to sponsor the Mercer Island Farmers Market for its 15th season!
Seattle Metro
- Ballard
- Capitol Hill (Broadway)
- Columbia City
- Lake City
- Lake Forest Park
- Madrona
- Magnolia
- Phinney
- Pike Place
- Queen Anne
- Shoreline
- U-District
- Wallingford
- West Seattle
Greater Eastside
- Bellevue – Crossroads
- Bellevue – Downtown
- Carnation
- Duvall
- Issaquah
- Kirkland – Downtown
- Kirkland – Juanita
- Mercer Island (Sponsored by Windermere MI!)
- North Bend
- Redmond
- Renton
- Sammamish
- Woodinville

Seattle Metro
Ballard
Seattle’s first year-round Farmers Market, selling produce exclusively from Washington state farmers along the historic cobblestone stretch of Ballard Ave.
Sundays, 9am – 2pm | Year-Round
5345 Ballard Ave NW | Seattle
sfmamarkets.com/visit-ballard-farmers-market/
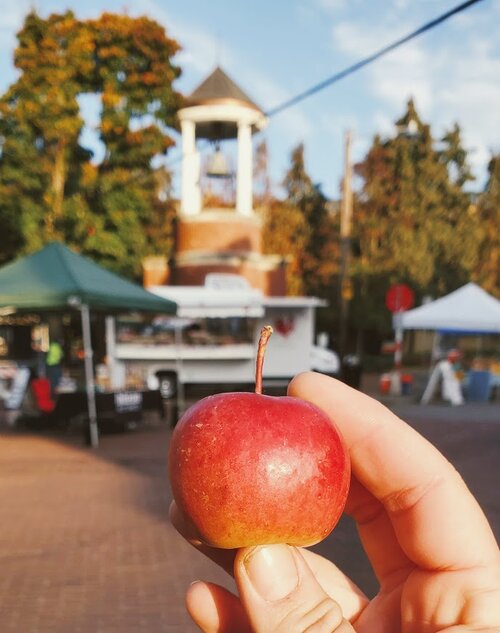
Photo courtesy of sfmamarkets.com
Capitol Hill (Broadway)
Come for Sunday brunch from food vendors who source ingredients from local, WA state farms (many of whom you’ll also meet selling their wares at the market). Live music and street performers often make an appearance, too.
Sundays, 11am – 3pm | Year-Round
E Barbara Bailey Way | Seattle
seattlefarmersmarkets.org/chfm
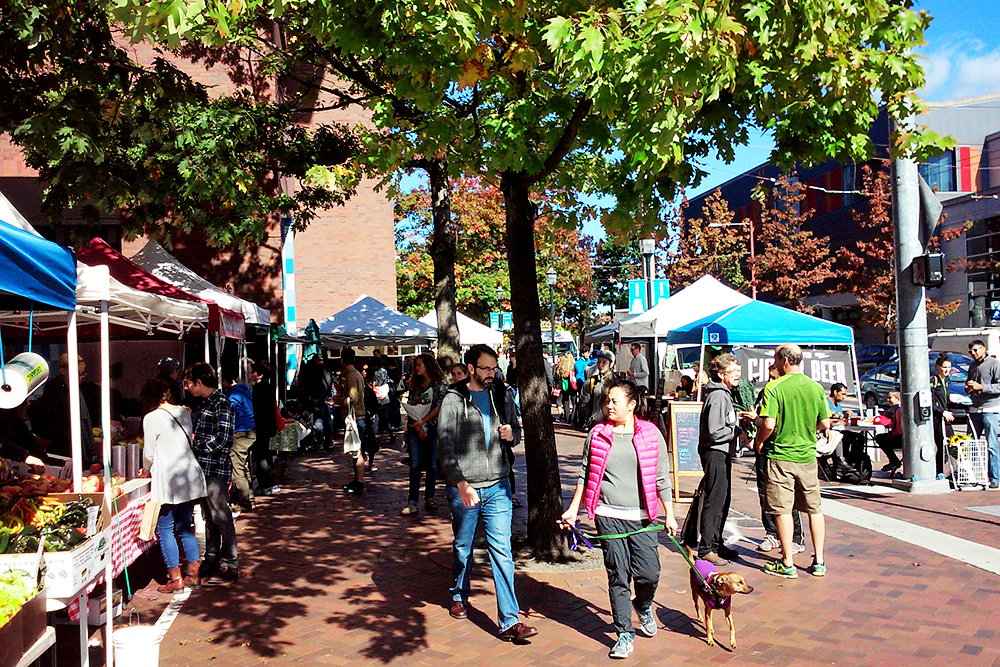
Photo courtesy of do206.com
Columbia City
With everything from freshly harvested Asian greens to Ethiopian eats, come check out the immense variety King County’s most diverse zip code has to offer. Bring your bounty to adjacent Columbia Park for a picnic.
Wednesdays, 3pm – 7pm | May 4 – Oct 12, 2022
37th Ave S | Seattle
seattlefarmersmarkets.org/ccfm
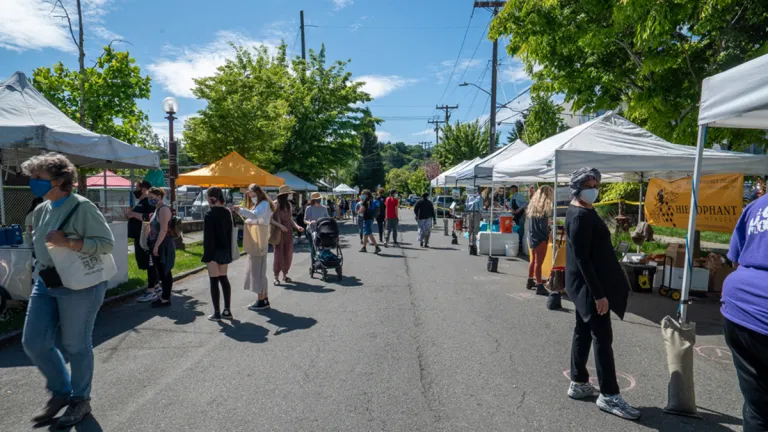
Photo courtesy of SouthSeattleEmerald.com
Lake City
This celebrated North End seasonal market offers unique finds grown and prepared by local farms and food artisans. Enjoy kids’ activities, too!
Thursdays, 3pm – 7pm | June 16 – Oct 6, 2022
NE 125th St & 28th Ave NE | Seattle
seattlefarmersmarkets.org/lcfm
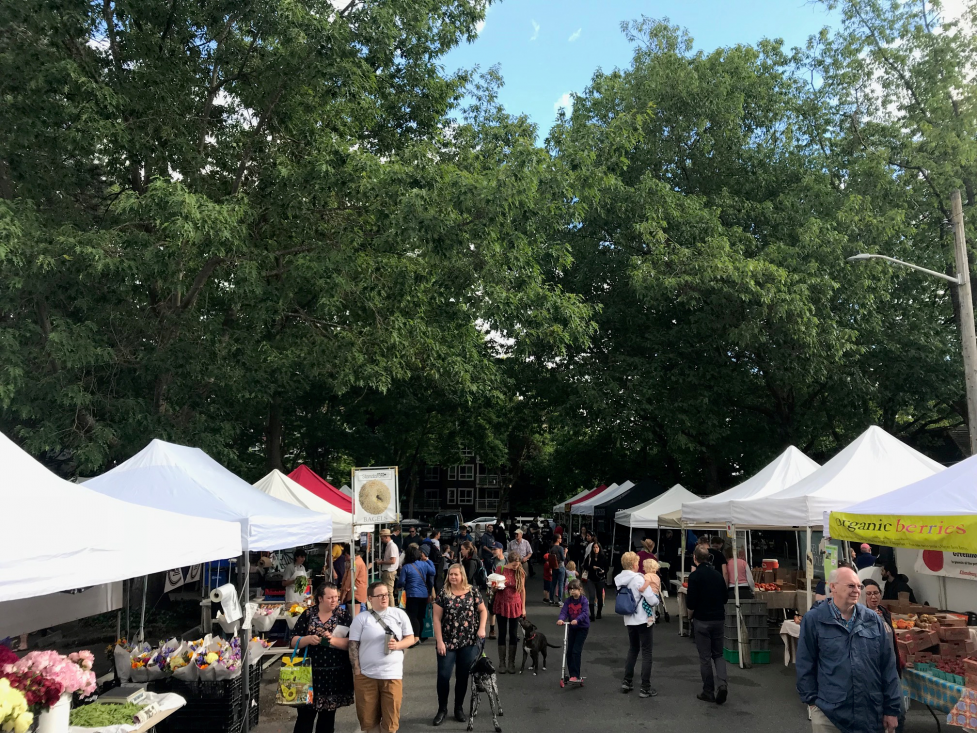
Photo courtesy of enjoylakecity.org
Lake Forest Park
With an emphasis on fresh, locally grown food, this market is an epicurean’s delight. Browse hard cider, baked goods, preserves, meat, pasta, sauces, and prepared foods along with the locally harvested fruits and veggies. There is also one “Crafts Market” each summer featuring local artisans.
Sundays, 10am – 2pm | May 8 – Oct 16, 2022
17171 Bothell Way NE | Lake Forest Park
www.thirdplacecommons.org/farmers-market
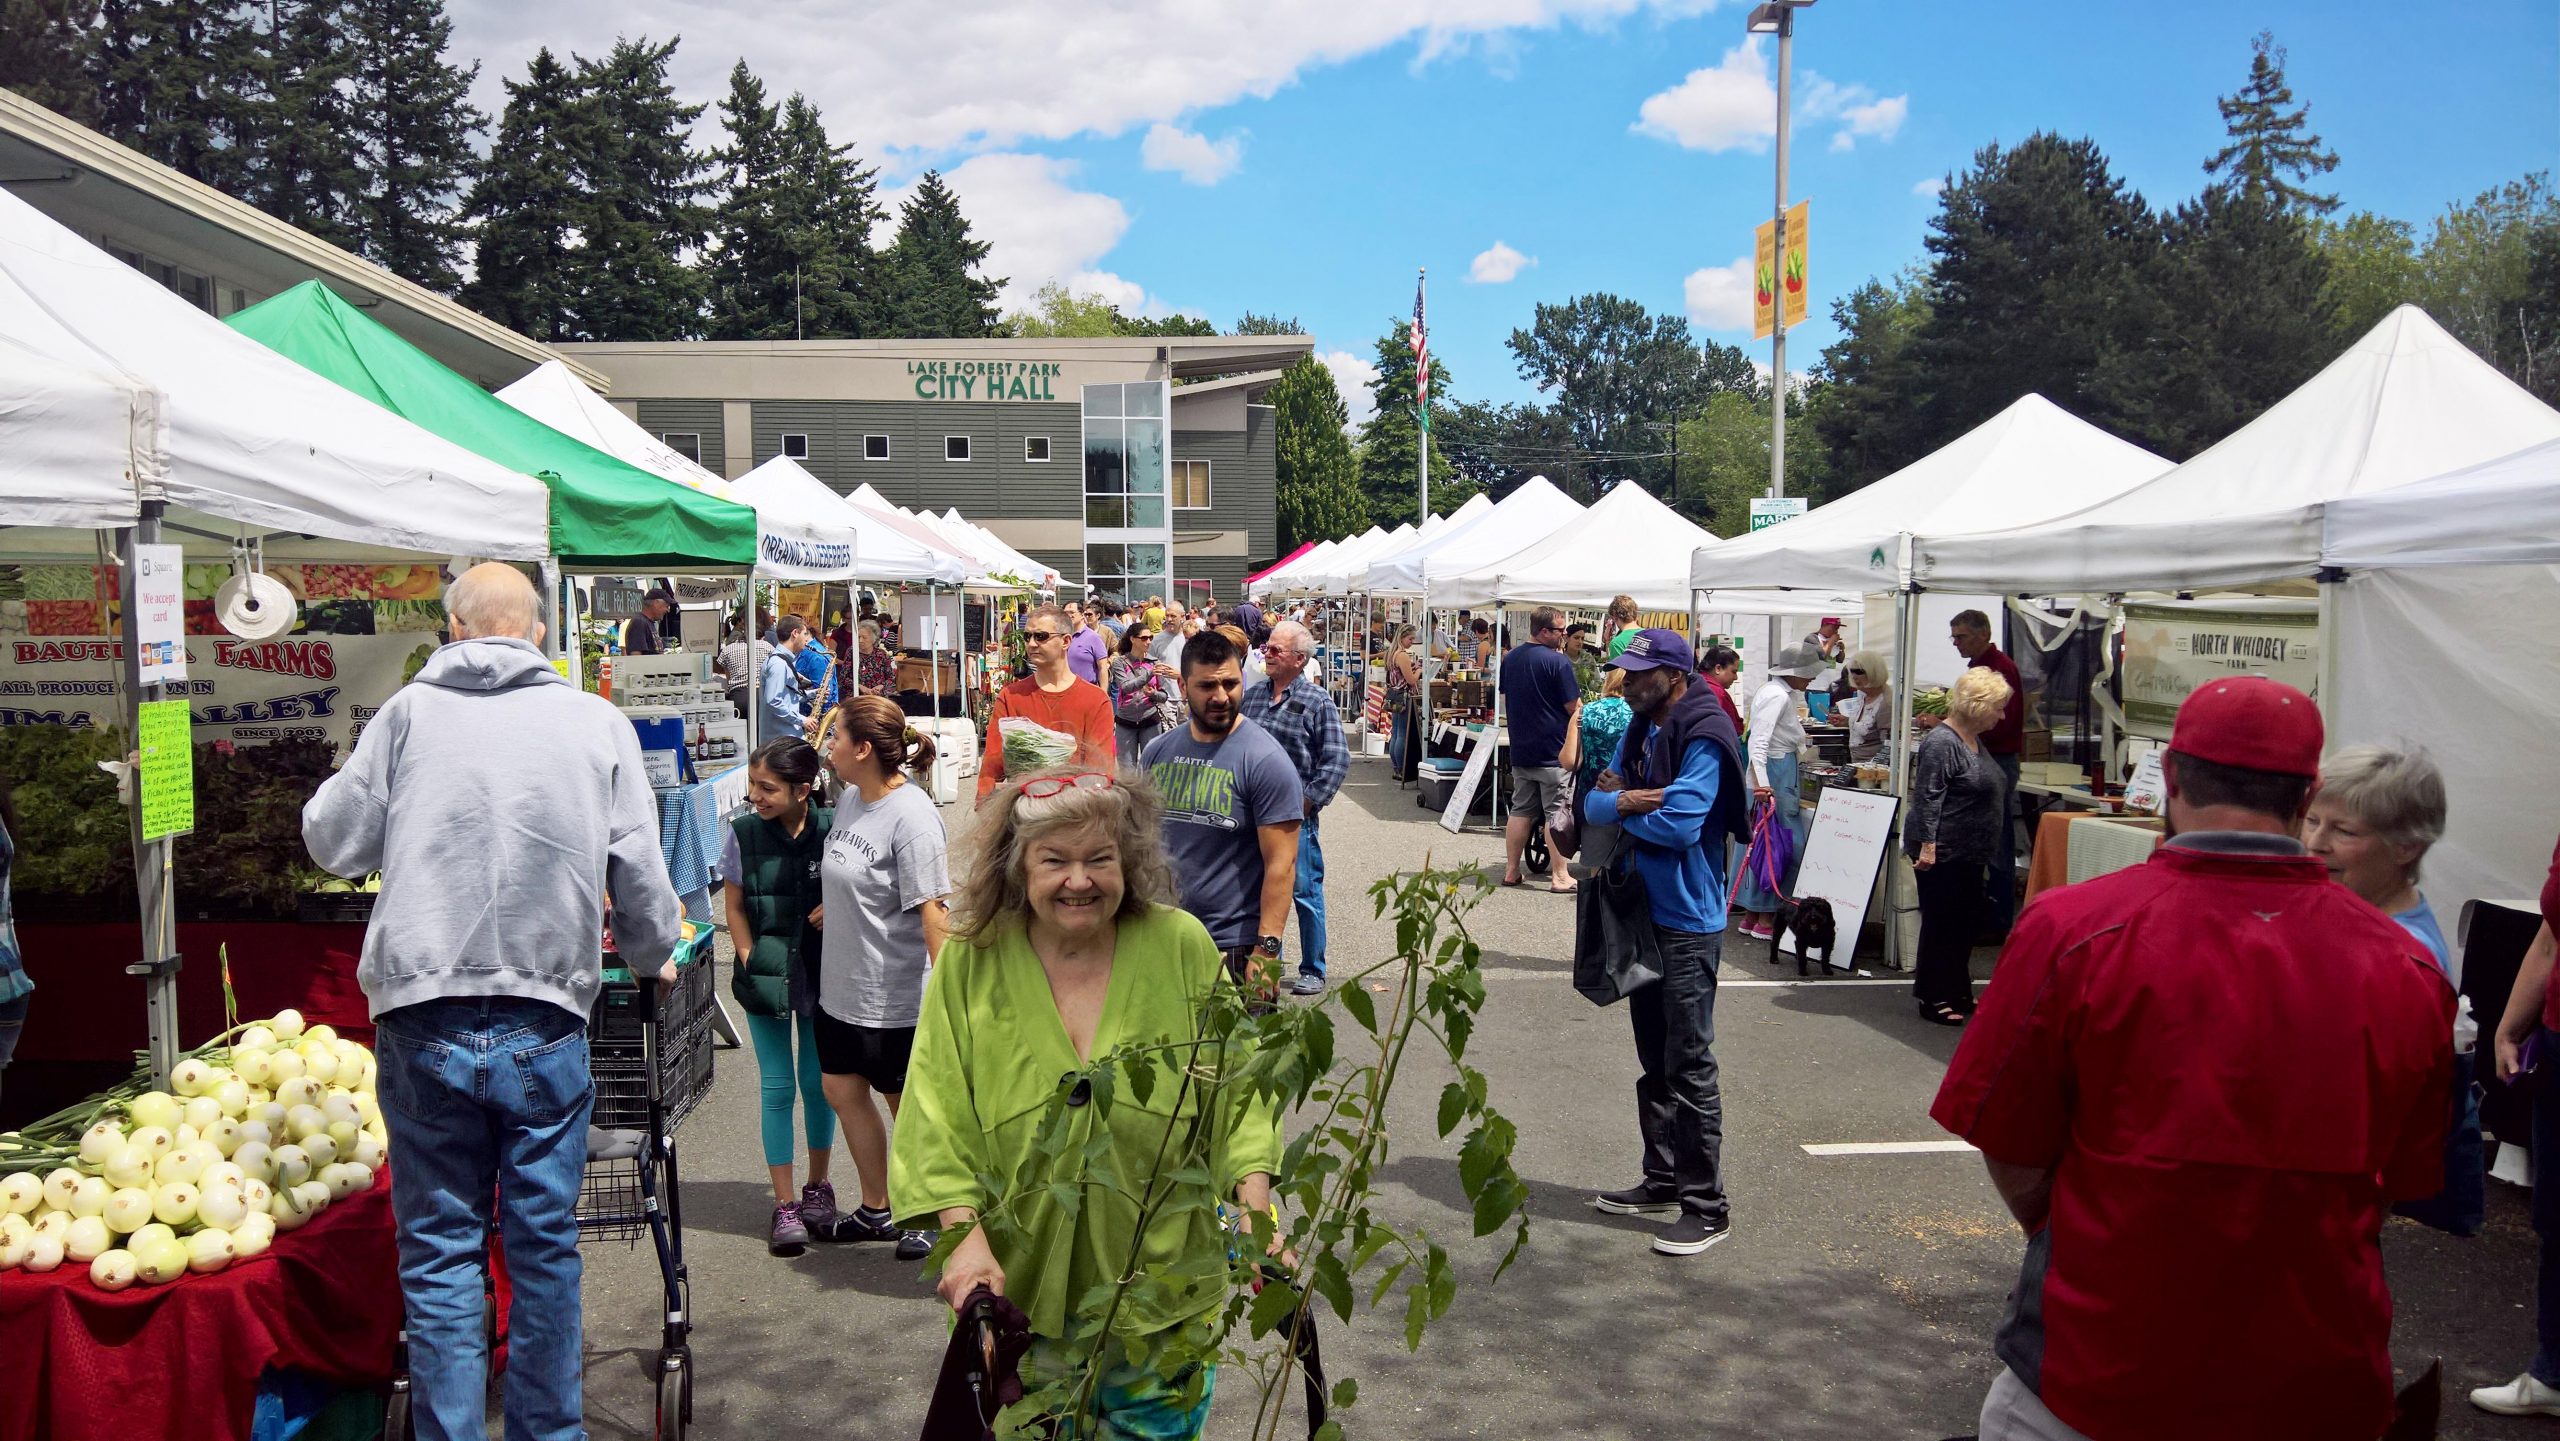
Photo courtesy of www.thirdplacecommons.org
Madrona
Located in one of Seattle’s most diverse neighborhoods, you’ll find artisan foods as well as seasonal produce from Washington state farmers, fishers, and ranchers.
Fridays, 3pm – 7pm | May 13 – Oct 21, 2022
MLK Way & E Union St | Seattle
sfmamarkets.com/madrona-farmers-market

Photo courtesy of sfmamarkets.com
Magnolia
This popular Saturday market is nestled in the tree-lined Magnolia Village. In addition to seasonal fruits and veggies, you’ll find sweet & savory pies, fresh bread, flowers, and more!
Saturdays, 10am – 2pm | June 4 – Oct 15, 2022 + Harvest Market on Nov 19, 2022
W McGraw St & 33rd Ave W | Seattle
seattlefarmersmarkets.org/mfm
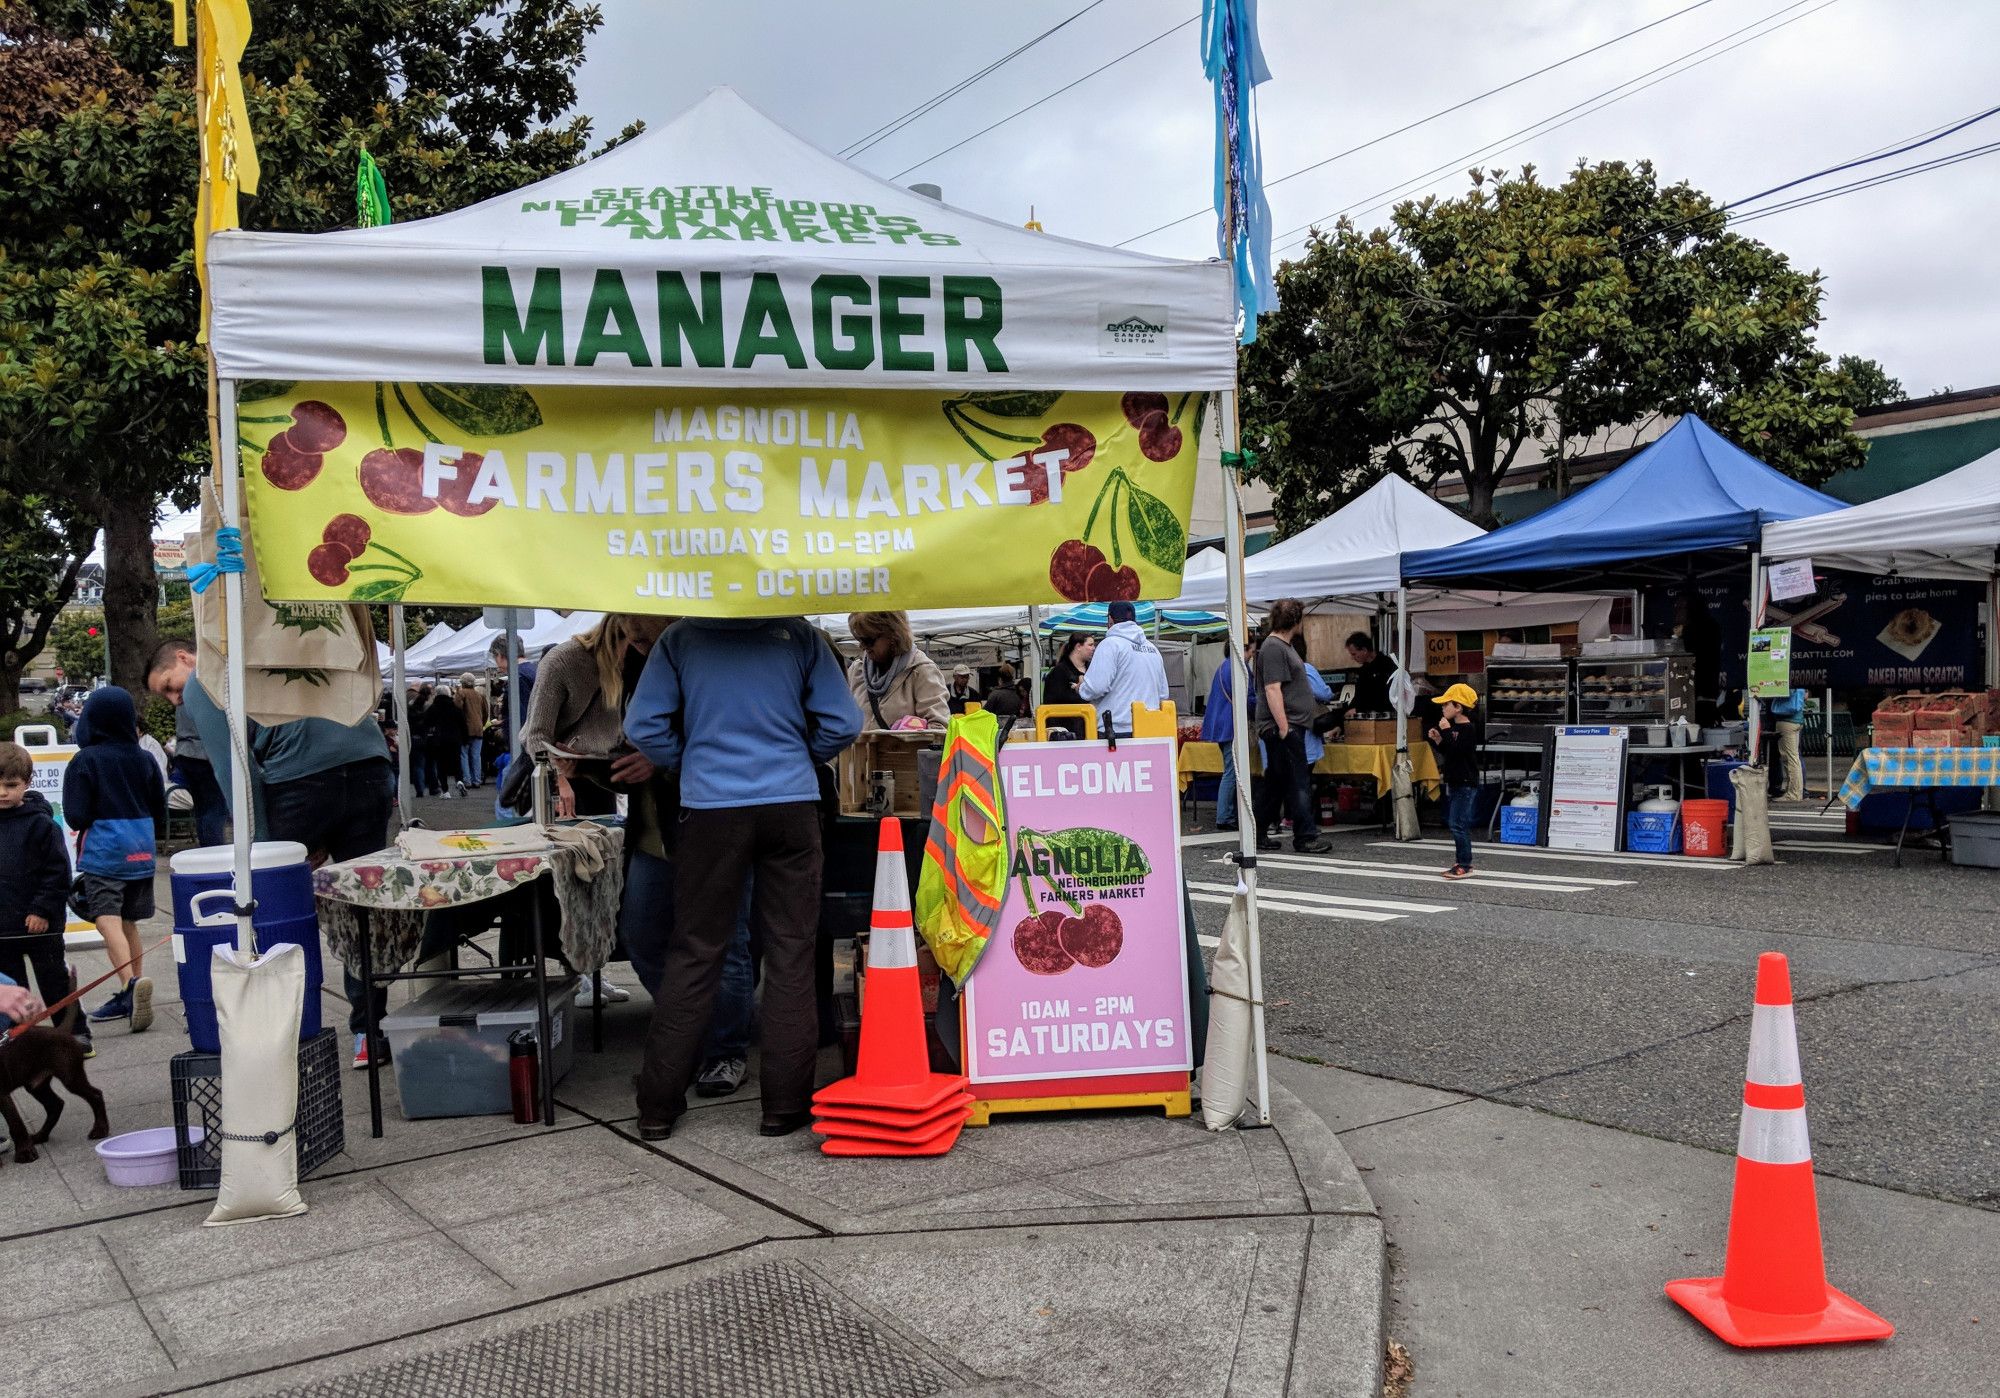
Photo courtesy of pinterest.com
Phinney
A popular gathering spot for both the Phinney Ridge and Greenwood communities, this market is right next door to a playground and offers live music in addition to the great mix of fresh produce and prepared food.
Fridays, 3pm – 7pm | June 3 – Sept 30, 2022
6761 Phinney Ave N | Seattle
seattlefarmersmarkets.org/pfm
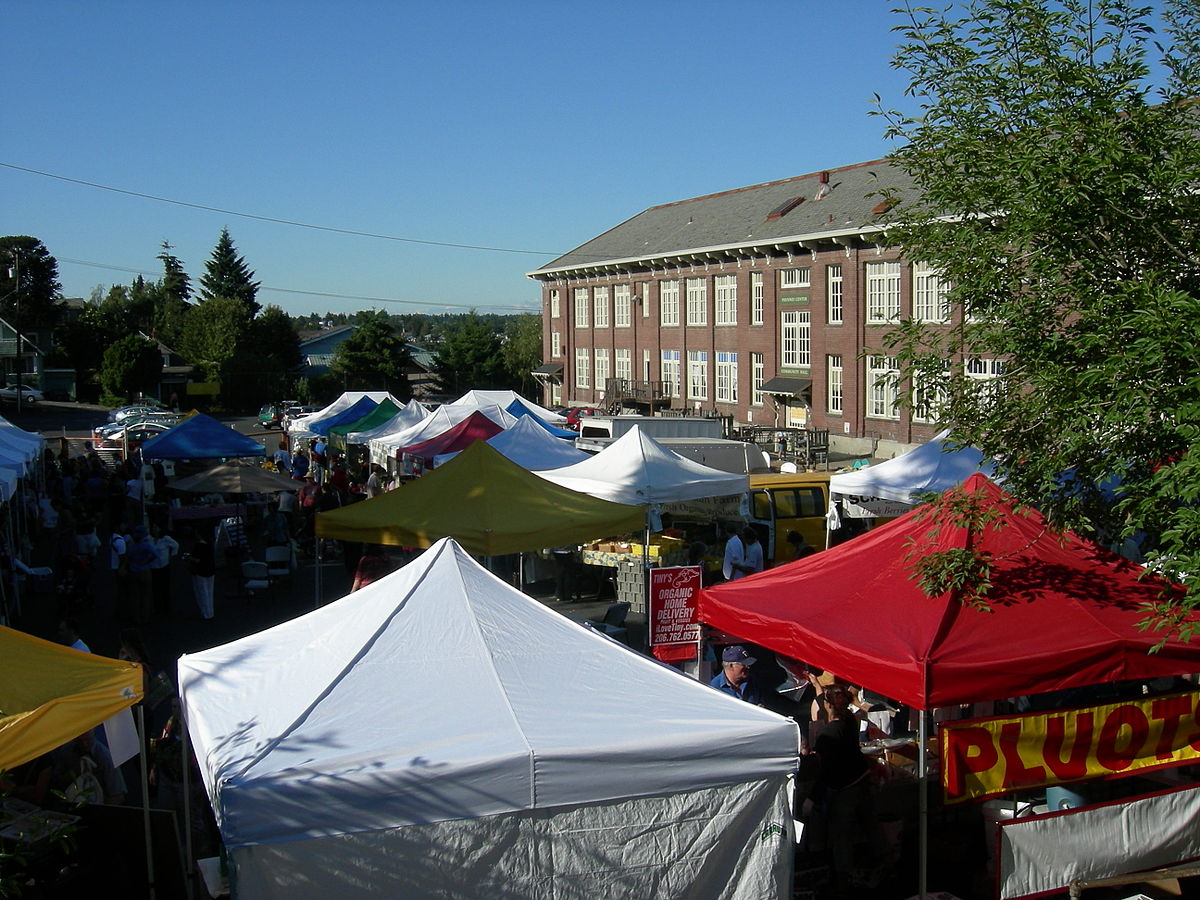
Photo courtesy of wikipedia.org
Pike Place
No introduction needed…make it a day with great restaurants, eateries and retail shops, too.
Daily, 9am – 6pm | Year-Round (Closed Thanksgiving & Christmas)
Pike Place between Pine & Virginia St | Seattle
(206) 682-7453
pikeplacemarket.org
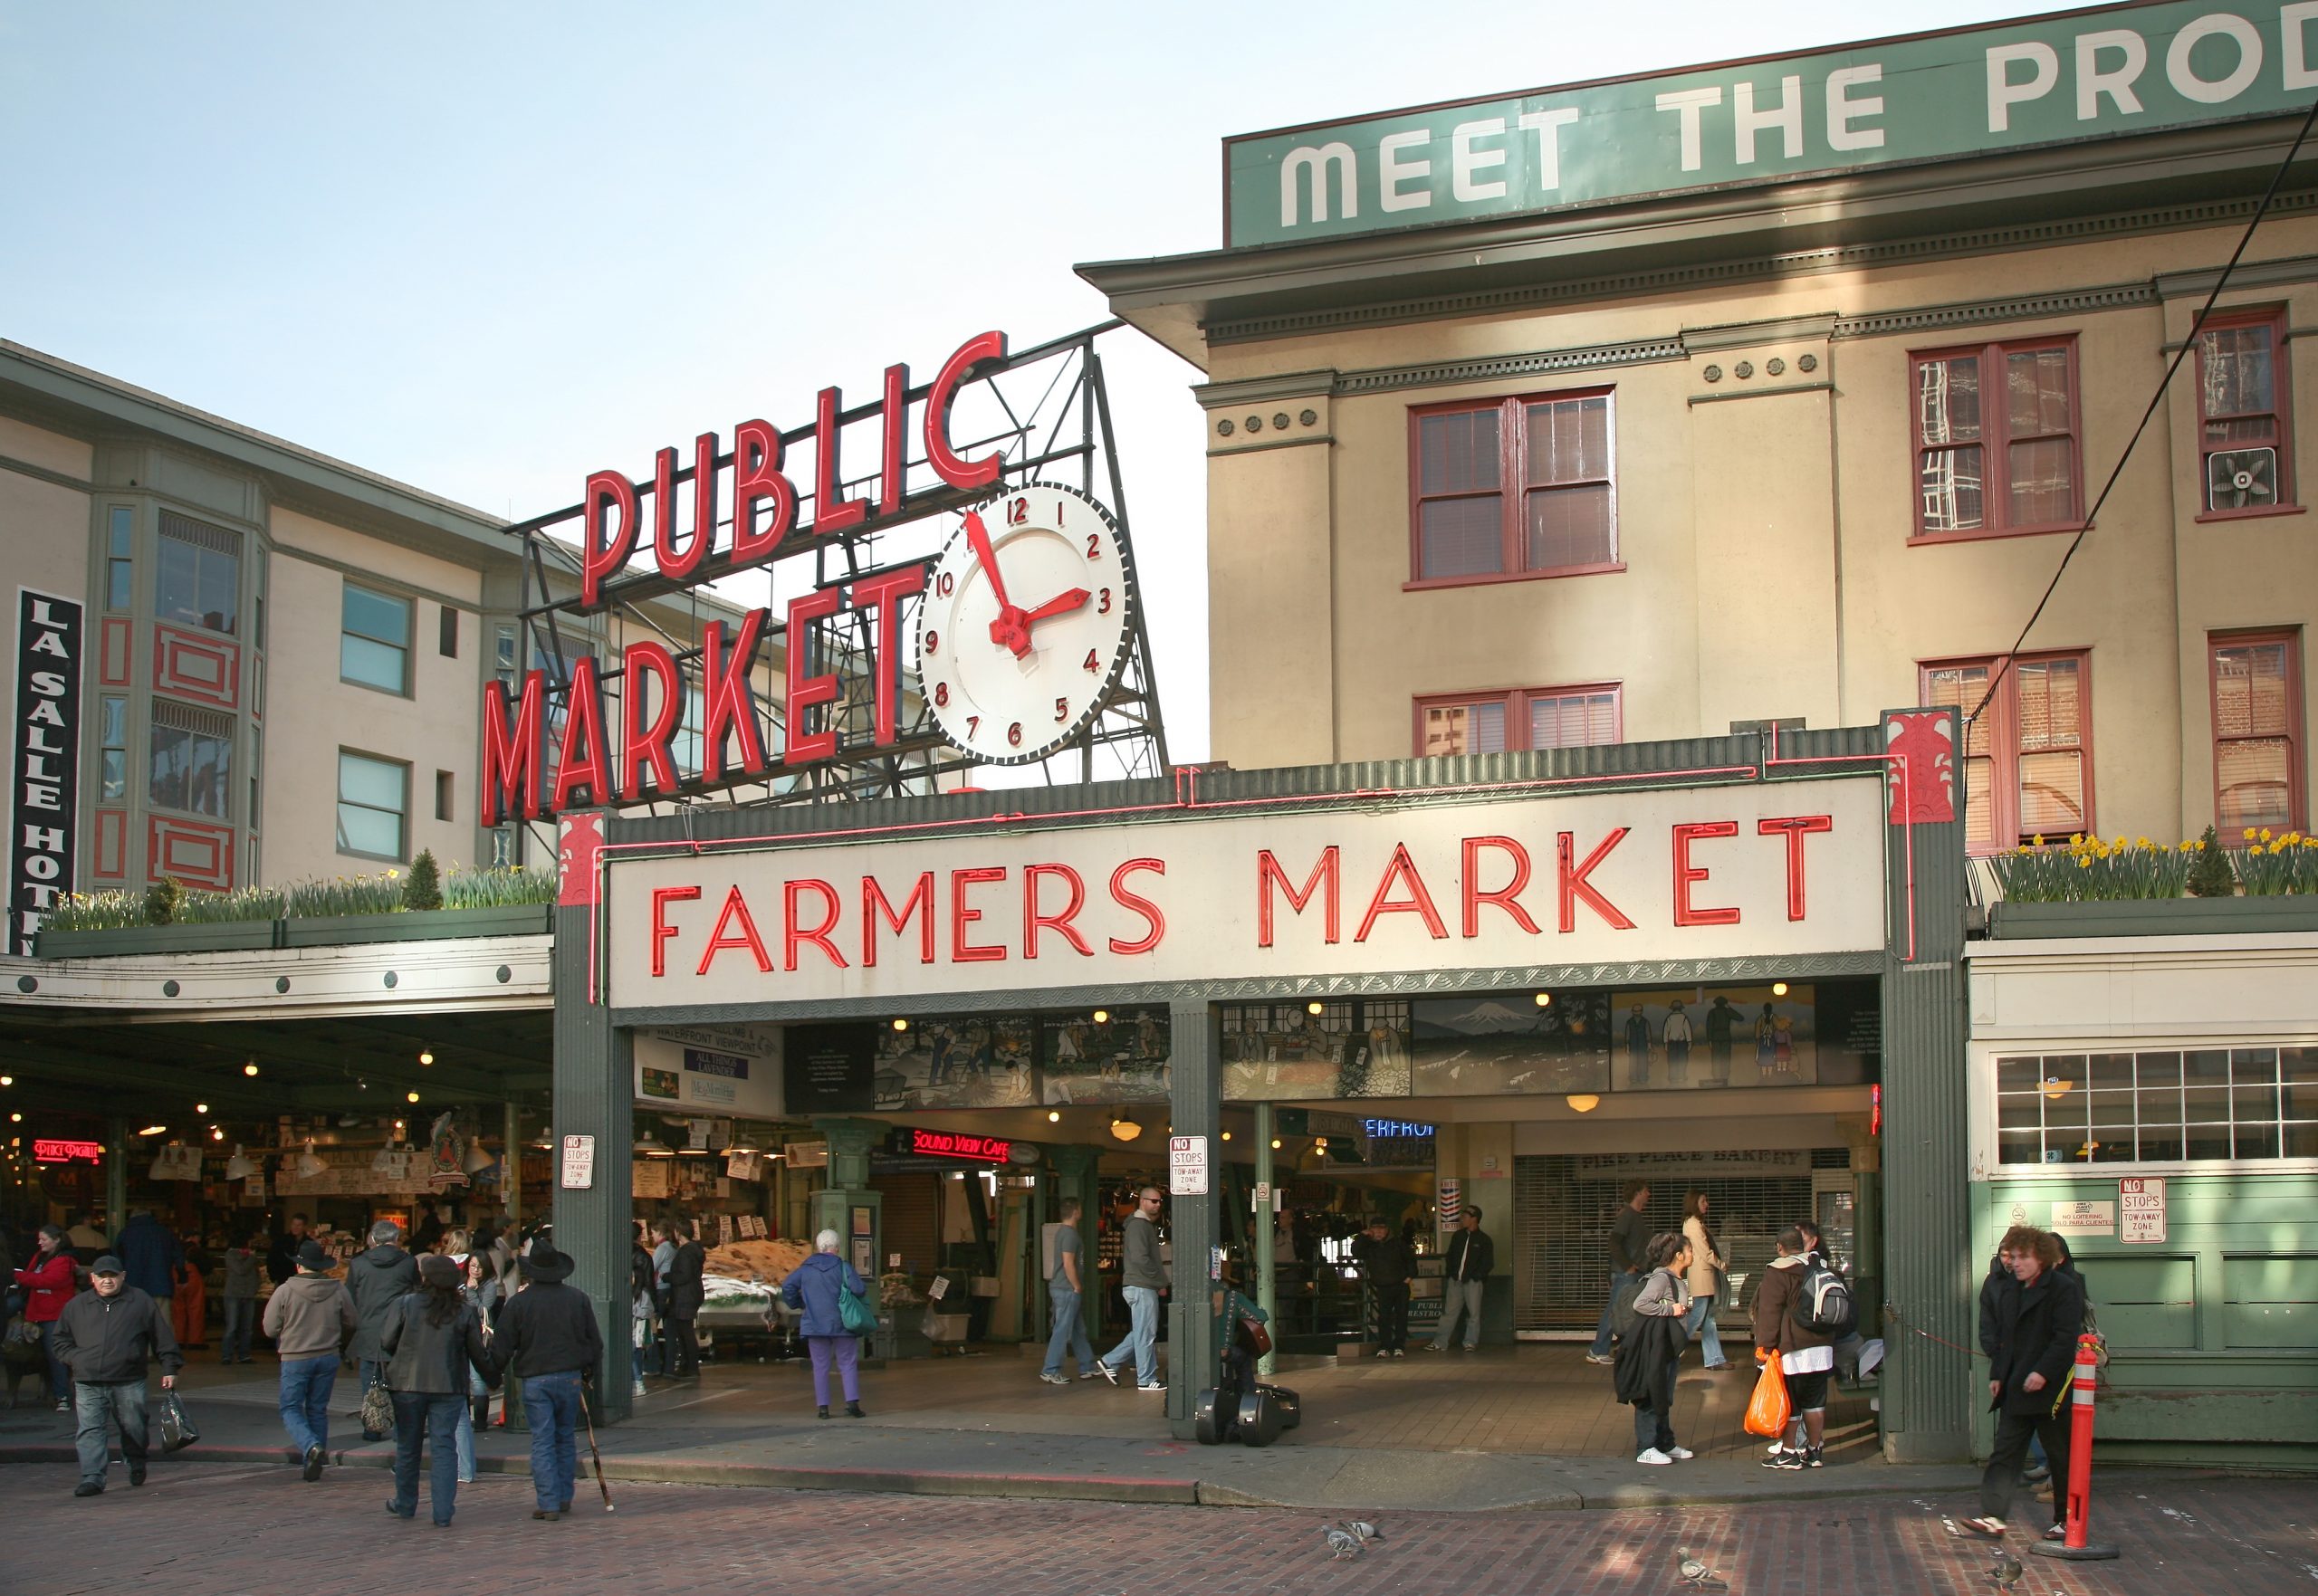
Photo by Daniel Schwen
Queen Anne
Seattle’s only independent farmers market, offering food, chef demos, live music, and children’s activities.
Thursdays, 3pm – 7:30pm | June 2 – Oct 13, 2022 + Harvest Markets on 10/29, 11/19 & 12/17
Queen Anne Ave N & W Crockett St | Seattle
qafm.org

Photo courtesy of qafm.org
Shoreline
Starting this year in their NEW location at the Shoreline Park & Ride, this market offers kids’ programs and live music in addition to its fresh Washington produce, organic meats, bread, honey, and prepared foods. Check out the schedule for info about vendors and entertainment.
Saturdays, 10am – 2pm | June 4 – Oct 1, 2022 + Harvest Markets on 10/29 & 12/17
18821 Aurora Ave N | Shoreline
shorelinefarmersmarket.org
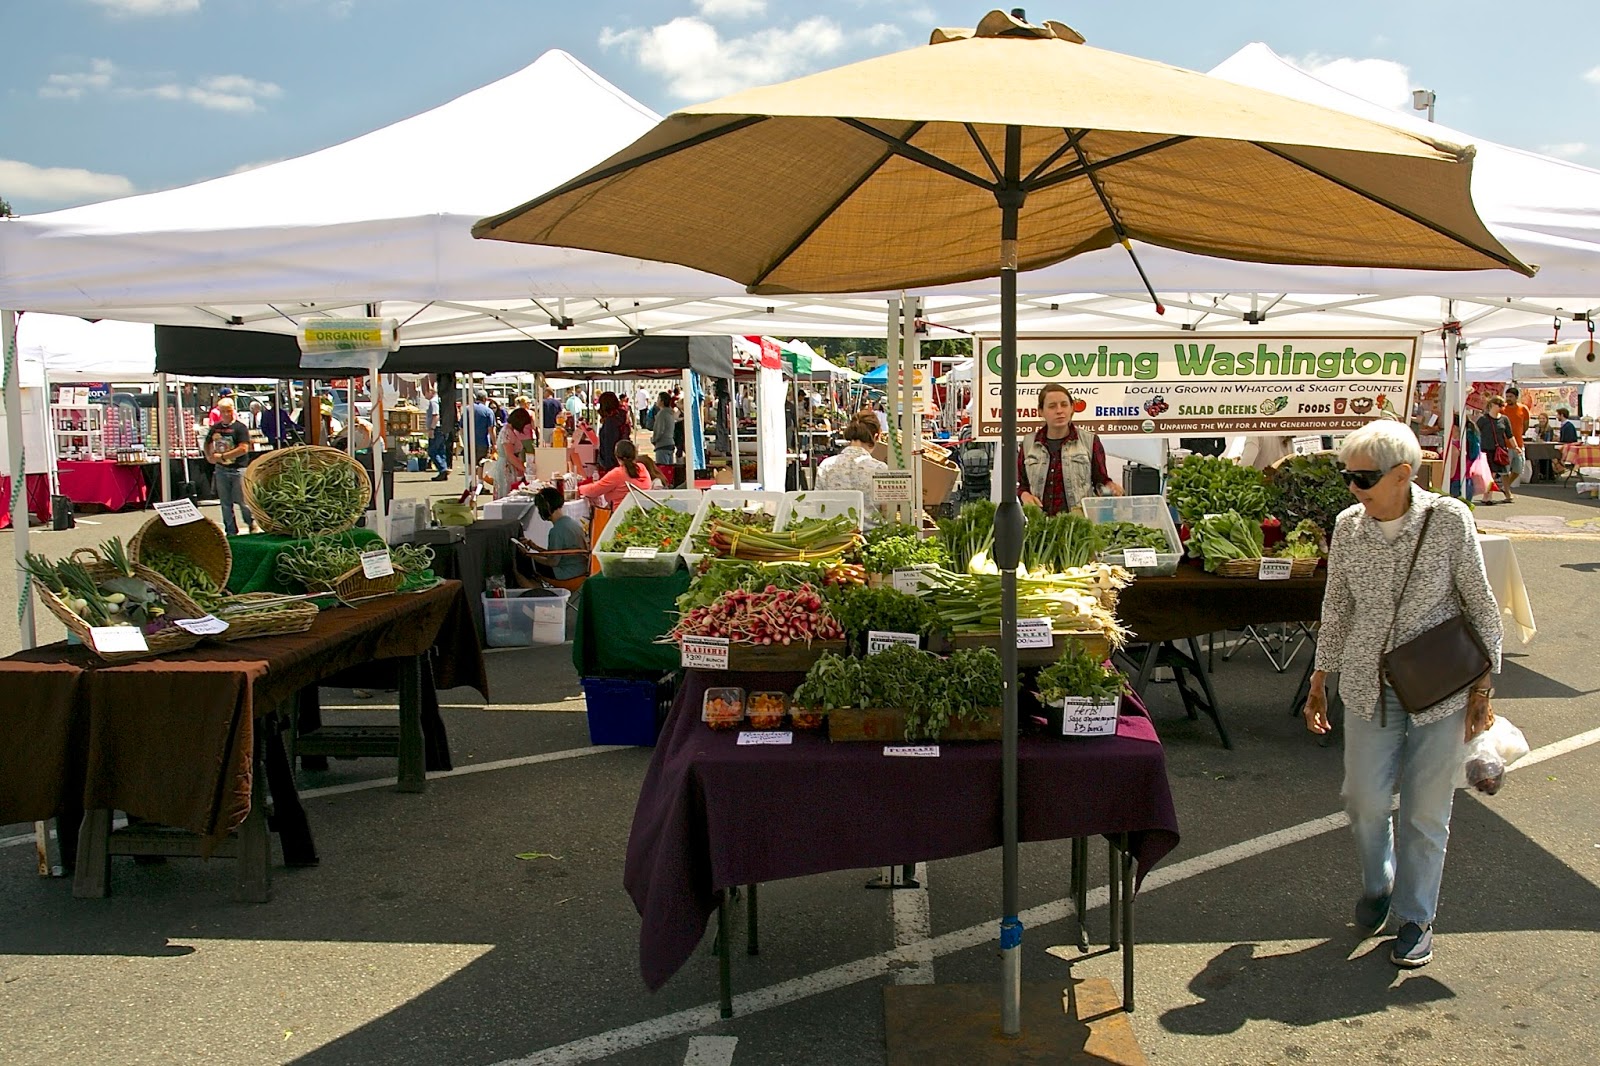
Photo courtesy of www.shorelineareanews.com
University District
Seattle’s only independent farmers market, offering food, chef demos, live music, and children’s activities.
Saturdays, 9am – 2pm | Year-Round
University Way NE (the “Ave”) between 50th & 52nd | Seattle
seattlefarmersmarkets.org/udfm

Photo courtesy of pinterest.com
Wallingford
Located in Meridian Park, you can shop with the whole fam and then enjoy a picnic or playtime at the award-winning playground.
Wednesdays, 3pm – 7pm | May 25 – Sept 28, 2022
4800 Meridian Ave N | Seattle
sfmamarkets.com/visit-wallingford-farmers-market/
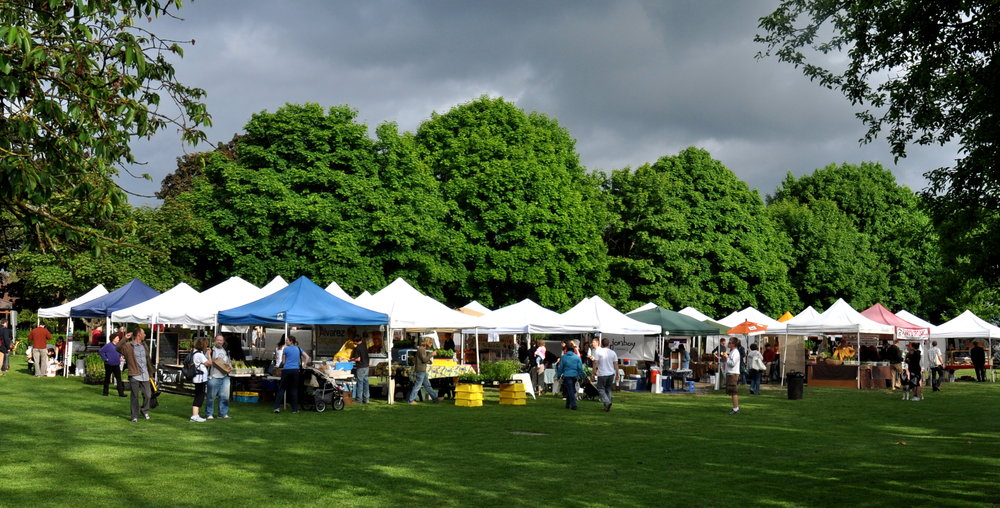
Photo courtesy of sfmamarkets.com
West Seattle
A South Seattle weekend destination, this market is set in the vibrant West Seattle Junction and features up to 70 vendors during the summertime peak. Great community atmosphere celebrating Washington grown food and ingredients.
Sundays, 10am – 2pm | Year-Round
California Ave SW & SW Alaska | Seattle
seattlefarmersmarkets.org/wsfm
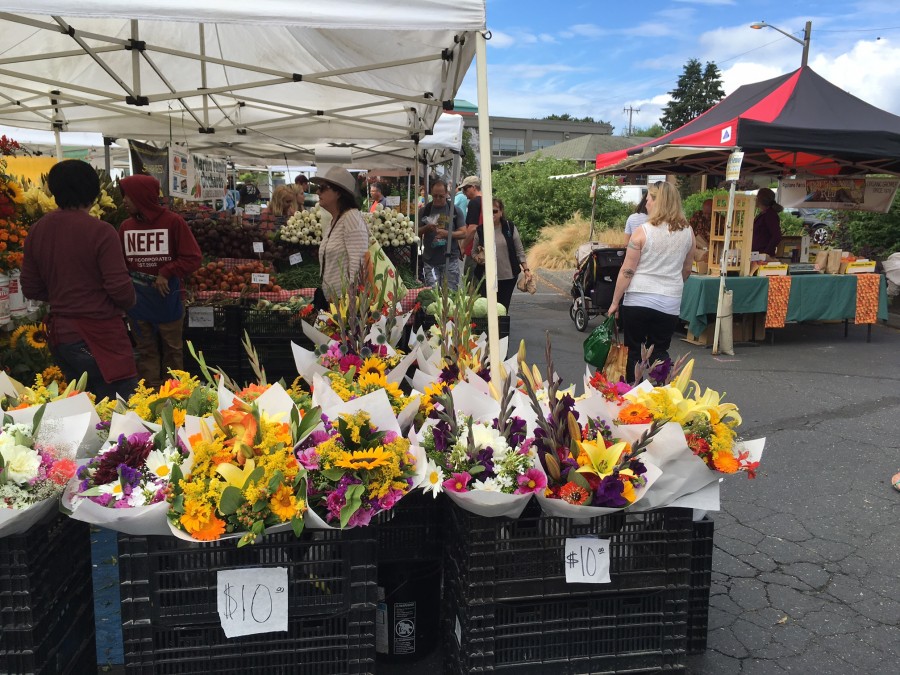
Photo courtesy of westseattleblog.com
Greater Eastside
Bellevue – Crossroads
East Bellevue’s market features fruits, veggies & dairy products from Washington state farms along with handmade soaps, candles, greeting cards, herbal wellness products, and more. Don’t missed the locally roasted coffee and handmade ice cream sandwiches, too!
Tuesdays, 12pm – 6pm | June 7 – Sept 27, 2022
15600 NE 8th St | Bellevue
https://crossroadsbellevue.com/music-events/crossroads-farmers-market/
Photo courtesy of crossroadsbellevue.com
Bellevue – Downtown
Set in the heart of Downtown Bellevue, this market offers goods exclusively produced within Washington state—from seasonal fruits & veggies to flowers, fresh meats, artisan goods, and prepared cuisine. The Kids’ POP club empowers kids to know where their food comes from and make healthy eating choices.
Thursdays, 3pm – 7pm | May 12 – Oct 6, 2022
Harvest Markets: 10am – 2pm on Sat, 10/15; Sat, 11/19; & Sat, 12/17
1717 Bellevue Way NE | Bellevue
bellevuefarmersmarket.org
Photo courtesy of eatbellevue.com
Carnation
Set in the heart of the Sno-Valley farming district, you’ll find plenty of freshly picked produce along with live music and educational activities for the kids.
Tuesdays, 3pm – 7pm | June, July & August 2022
Bird St & Stossel Ave | Carnation
carnationfarmersmarket.org
Photo courtesy of carnationfarmersmarket.org
Duvall
Nestled alongside the scenic Snoqualmie River, this friendly market features local eggs, jams, fresh roasted coffee, arts, crafts, and baked goods in addition to the seasonal veggies, fruits, and plant starts. Live music, picnic shelters and a playground make this a fun family destination.
Thursday, 3pm – 7pm | May 5 – October 13, 2022
Taylor Landing at 16201 Main St NE | Duvall
duvallfarmersmarket.org
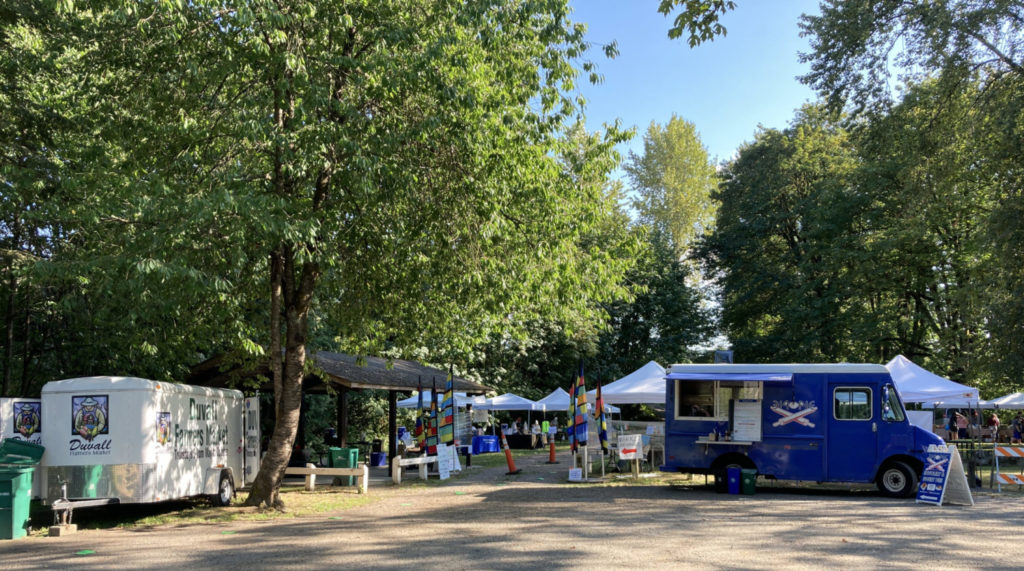
Photo courtesy of duvallfarmersmarket.org
Issaquah
Located at the historic Pickering Barn, this picturesque venue offers a variety of fresh farm and food-based products, concessions, and local artisans.
Saturdays, 9am – 2pm | May 7 – Sept 24, 2022
1730 10th Ave NW | Issaquah
www.issaquahwa.gov/778/Farmers-Market
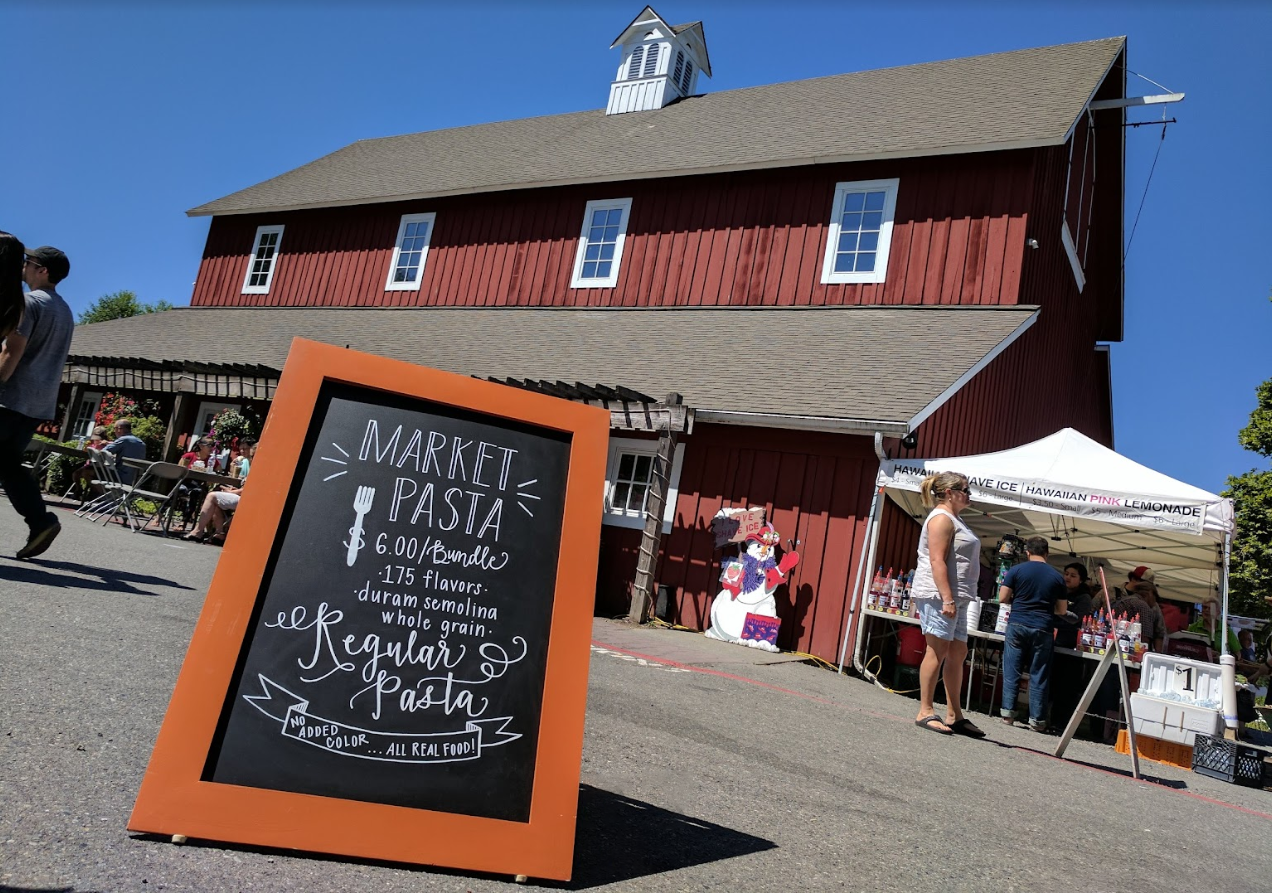
Photo by Saifu Angto, courtesy of google.com
Kirkland – Downtown
This stunning setting on the Lake Washington shoreline turns shopping into a day at the beach. Peruse local produce and goods, then go for a swim or stroll along Moss Bay. Perfect for a picnic, too!
Wednesdays, 3pm – 7pm | June – September, 2022
Marina Park, 25 Lakeshore Plaza | Kirkland
kirklandmarket.org
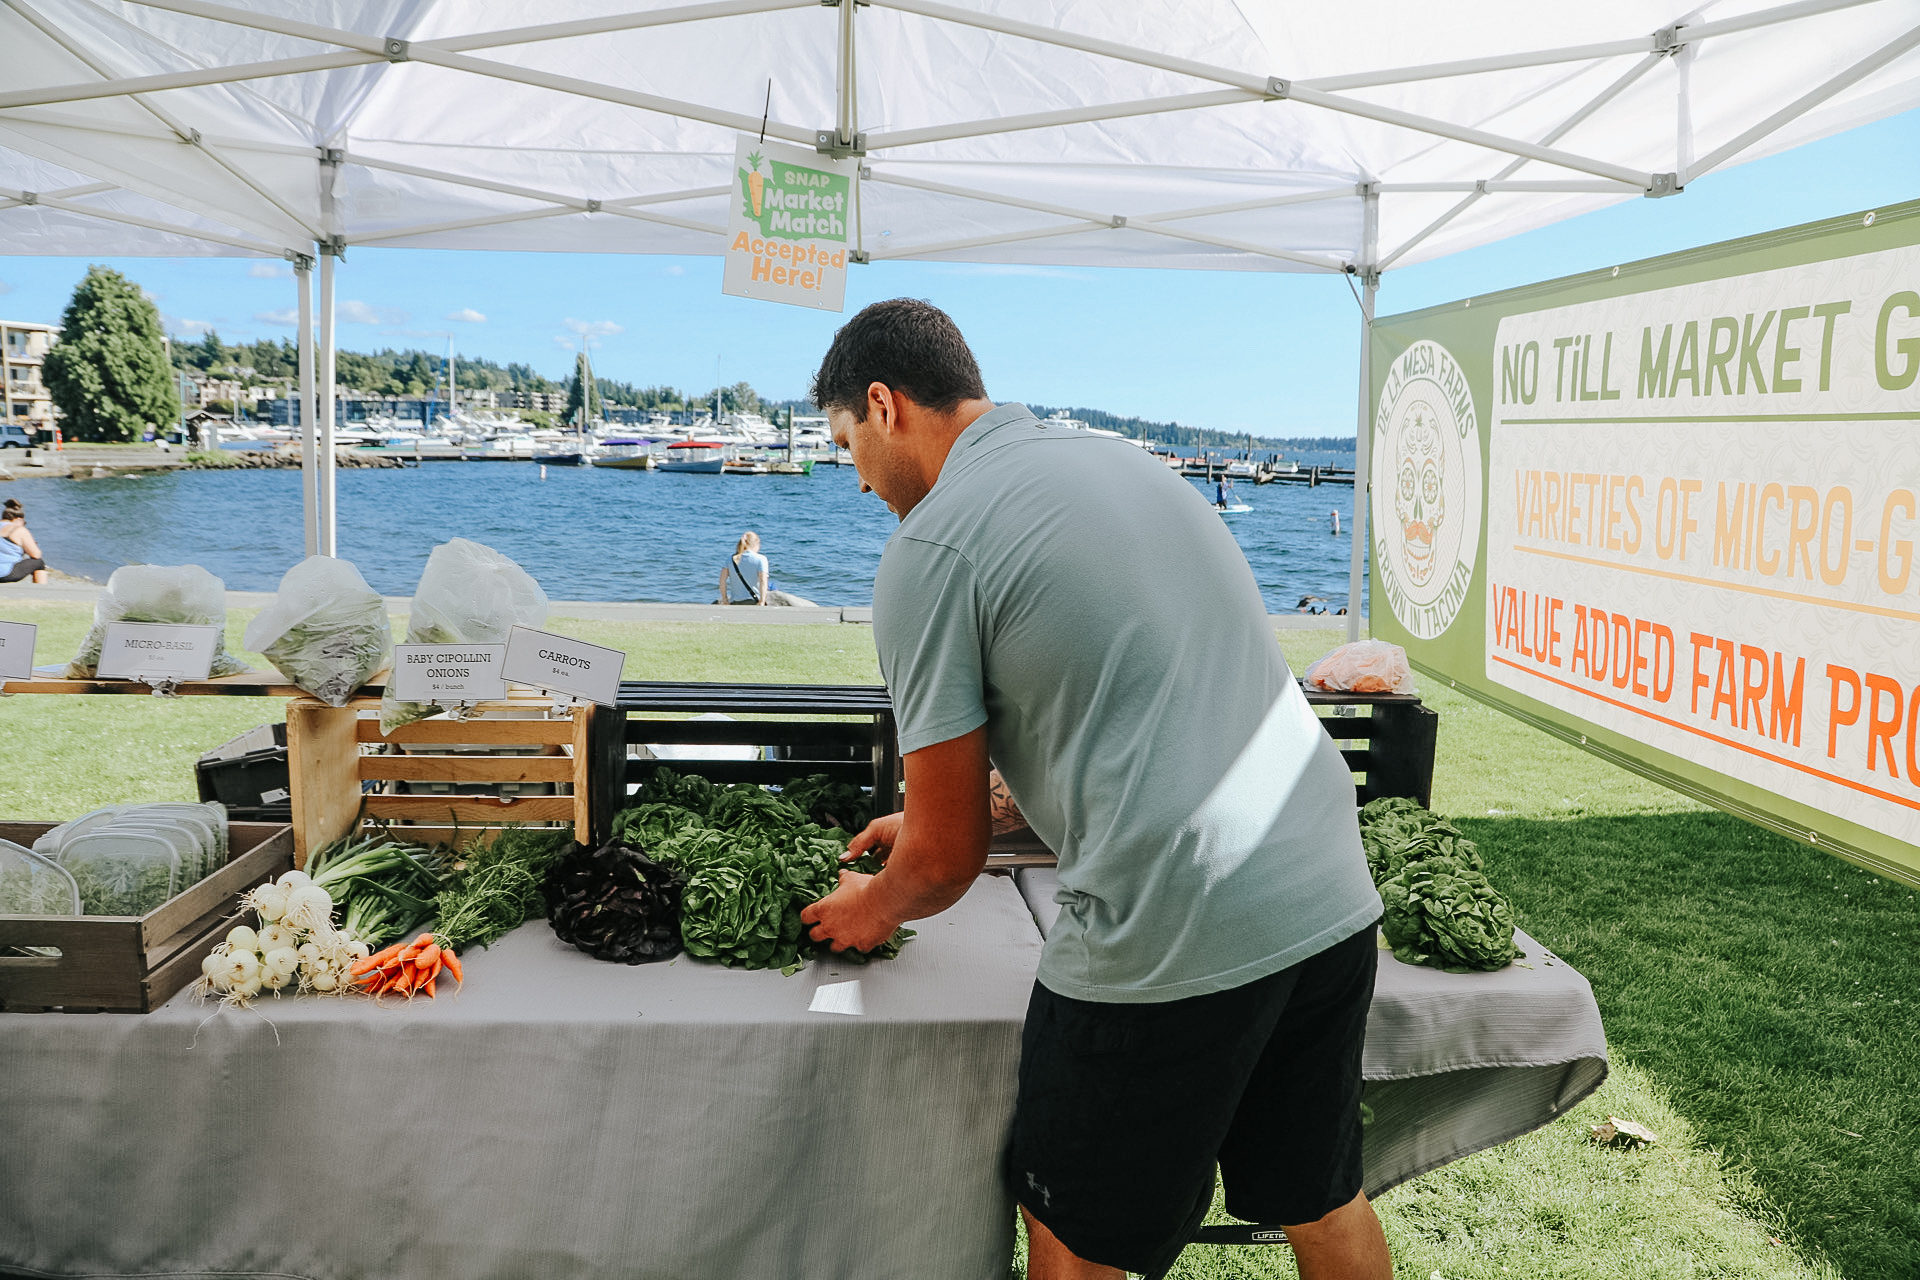
Photo courtesy of kirklandmarket.org
Kirkland – Juanita
Set in beautiful Juanita Beach Park on Lake Washington, you’ll find as many as 30 vendors offering farm fresh local produce, herbs, honey, nuts, flowers, plants, baked good, handcrafted items, and prepared cuisine. Make it a date with live music and a picnic at the beach. There’s a great playground for the kids, too.
Fridays, 3pm – 7pm | June – Sept, 2022
Juanita Beach Park, 9703 NE Juanita Dr | Kirkland
www.kirklandwa.gov
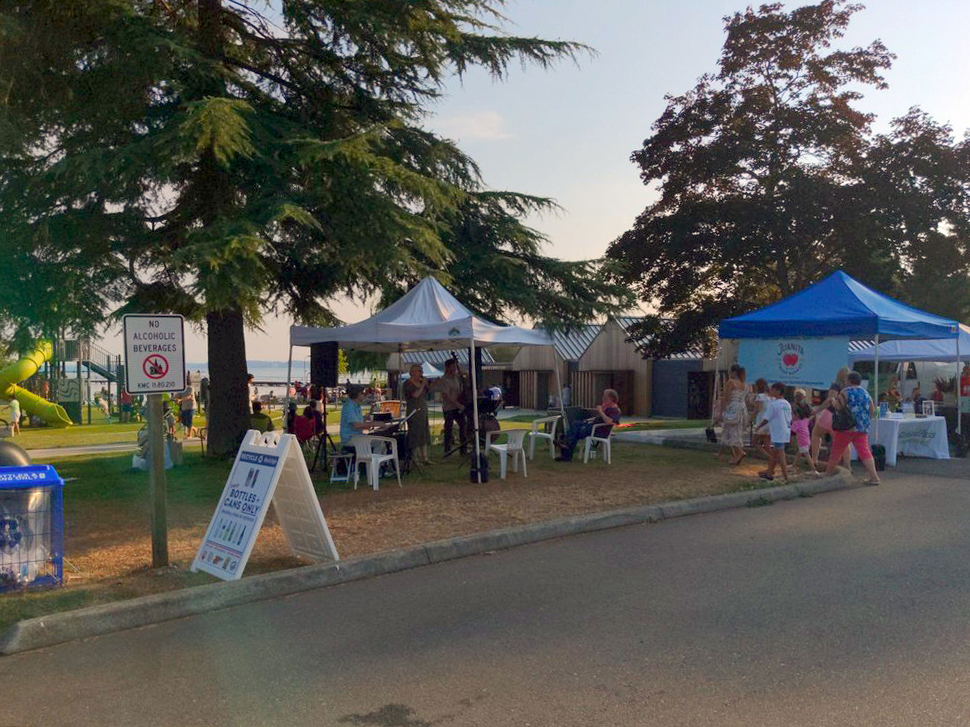
Photo courtesy of yelp.com
Mercer Island
Our office is so proud to sponsor this year’s Mercer Island Farmers Market! Come on down for quality local Washington state produce, cheese, fish, meat, bread, and more. Check out the live music schedule, too!
Sundays, 10am – 3pm | June – Sept, 2022
7700 SE 32nd St | Mercer Island
www.mifarmersmarket.org
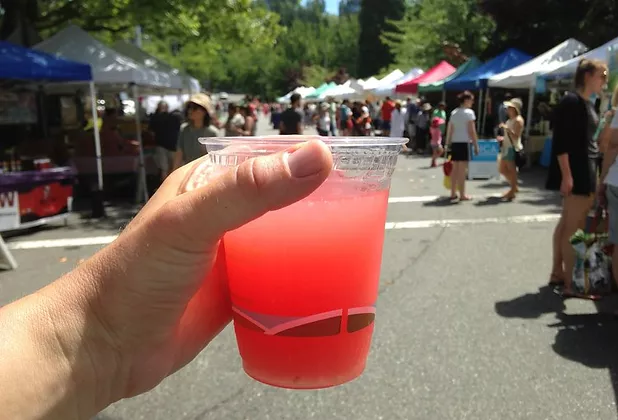
Photo courtesy of www.mifarmersmarket.org
North Bend
This relaxed market enjoys live music and a spectacular Mount Si view. Vendors offer fresh produce, berries, honey, flowers, baked goods, hand-crafted items, and delicious prepared foods. Two playgrounds plus play fields and a covered picnic shelter make this a fun hangout spot. Leashed pets are welcome, too!
Thursdays, 4pm – 8pm | June 9 – Sept 8, 2022
Si View Park, 400 SE Orchard Dr | North Bend
www.siviewpark.org/farmers-market.phtml
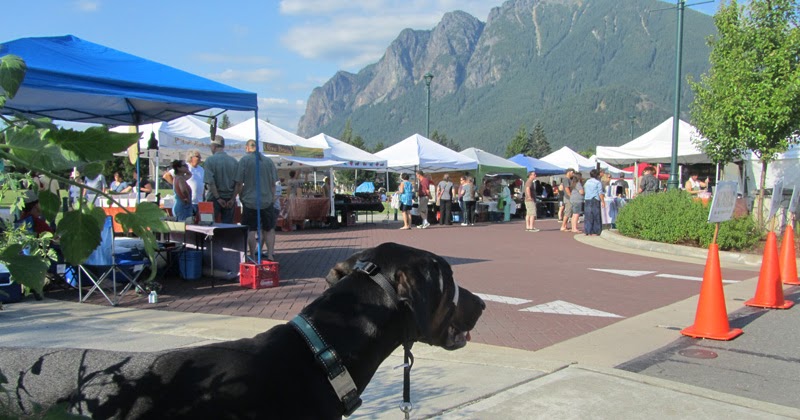
Photo courtesy of thequiltingdoberman.blogspot.com
Redmond
Going strong since 1976, the Redmond Saturday Market offers a huge selection of vendors and dazzling array of produce, flowers, cheeses, preserves, salmon, tea, and handmade goods such as pottery and soaps. You’ll love the ready-to-eat foods, too.
Saturdays, 9am – 2pm | May 7 – Oct 29, 2022
9900 Willows Rd | Redmond
www.redmondsaturdaymarket.org

Photo by Jeff, courtesy of google.com
Renton
Find exclusively Washington-produced fruits, veggies, handmade goods, arts, crafts and more right in the heart of downtown Renton at Piazza Park. Food trucks, live music, and kids’ activities such as the “Healthy Kids Corner” make this a fun spot to liven up your Tuesday.
Tuesdays, 3pm – 7pm | June – Sept, 2022
Piazza Park, 233 Burnett Ave. S | Renton
www.rentonfarmersmarket.com
Photo courtesy of yelp.com
Sammamish
Each Wednesday, the Sammamish Commons plays host to a variety of local farmers, nurseries, bakeries, artisans, food vendors, and more. Live music and kids’ activities, too!
Wednesdays, 4pm – 8pm | May – Sept, 2022
Sammamish Commons, 801 228 Ave SE | Sammamish
www.sammamishfarmersmarket.org
Photo courtesy of sammamishfarmersmarket.org
Woodinville
New location this year! Come check out downtown Woodinville’s newly renovated Schoolhouse District and find produce grown in the state of Washington (and picked fresh for that morning!). You’ll also have an array of boutique baked goods, sauces, cider, artisans, and more to peruse. Check out the calendar for live entertainment, music, demos, and other activities.
Saturdays, 10am – 3pm | May – Sept, 2022
13205 NE 175th St | Woodinville
woodinvillefarmersmarket.com

Photo courtesy of woodinvillefarmersmarket.com
We earn the trust and loyalty of our brokers and clients by doing real estate exceptionally well. The leader in our market, we deliver client-focused service in an authentic, collaborative, and transparent manner and with the unmatched knowledge and expertise that comes from decades of experience.
© Copyright 2022, Windermere Real Estate/Mercer Island.
How’s the Market? Q1-2022 Real Estate Review

Across the region, home values continued to see huge year-over-year gains from 2021 to 2022. Most homes sold in the first 10 days and for well above the asking price. We started the year with an extreme shortage of homes for sale, resulting in an overall lower number of sales compared to the start of 2021. Buyer demand, however, remains incredibly strong.
With interest rates on the rise, buyers are feeling more pressure than ever to secure a home. We are hoping to see more listings come to market this spring and provide some much needed relief for weary house hunters.
Click or scroll down to find your area report:
Seattle | Eastside | Mercer Island | Condos | Waterfront
SEATTLE
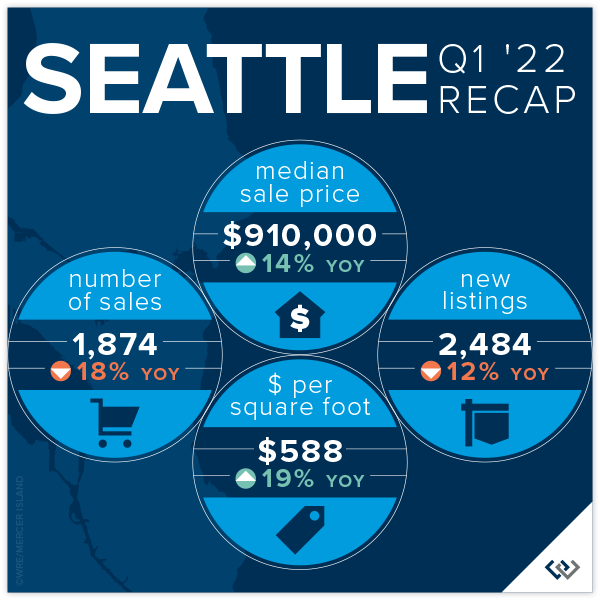
The Seattle real estate market for single family homes is off and running! The median sale price is up 6% since the end of 2021. Which means: Seattle’s price gains were as much in the first quarter as all of 2021. Year over year, the median price rose from $800,000 in Q1 2021 to $910,000 in Q1 2022.
For anyone who has focused their home search on the Eastside and has come up empty handed in 2021, Seattle could seem like an affordable opportunity this year. Seattle’s price gains were strong, albeit conservative in comparison with the Eastside. More plentiful active inventory (relatively speaking), and a more affordable median sale price of $910,000 (vs $1,625,000 on the Eastside) indicate that Seattle could be a bright spot of hope for any buyers left behind by the Eastside’s double-digit gains.
Rising interest rates in late Q1 are sure to play a part in the weary home buyer’s decision-making process. However, the close of quarter numbers are encouraging: 82% of homes sold in the first ten days!
Click here for the full report and neighborhood-by-neighborhood statistics!
EASTSIDE
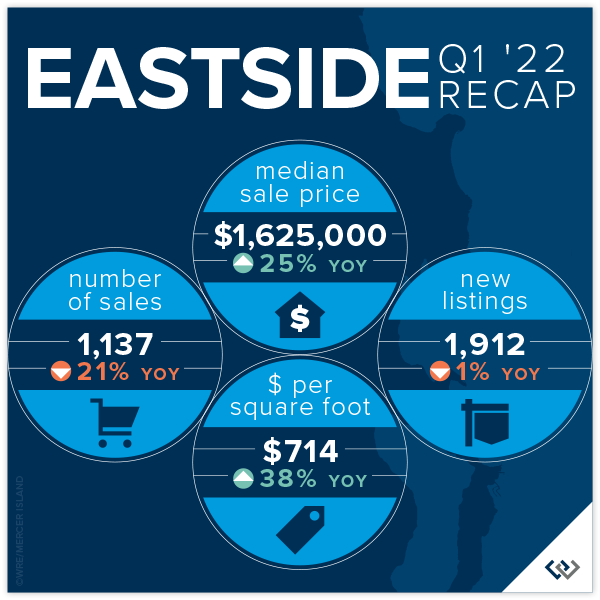
Once again Eastside Real Estate is off to an incredible start in the first 3 months of the year. Multiple offers and wildly aggressive escalation clauses are the story of the day, and not just anecdotally—the numbers don’t lie. The average list to sale price ratio was a staggering 119%, which means the typical home listed at $1,000,000 sold for closer to $1,190,000. This is an even stronger showing than the previous record high of 112% in Q1 of 2021.
New listings were relatively flat compared to Q1 of 2020 and 2021 (1912 vs 2058 and 1935 respectively) while the total number of sales were down 21% (1137 vs 1413 in the prior year). We believe this can be explained by looking at the trailing inventory from the previous Q4 in both cases (1496 vs 1238). There were just fewer homes for sale, certainly not less demand. This was reflected in the overall price gain of 25%!
Without a crystal ball it will be tough to tell exactly how much impact the market will feel from the steep rise in interest rates. In the short term, everyone seems to be taking a deep breath as we move into Q2. Overall, the Eastside’s core values—highly ranked schools, community focused neighborhoods, and close commute proximity to some of the area’s largest employers—should keep the area in high demand!
Click here for the full report and neighborhood-by-neighborhood statistics!

MERCER ISLAND
Mercer Island by the averages was quite shocking in Q1 of 2022: 3 homes per sale per week, 11 days on market, and 111% list price to sale price. This translates to buyers who would have otherwise joined our community casting a wider net to places like Bellevue, Issaquah, and Sammamish.
One of the affordability indicators that we historically track has become obsolete over the past few quarters: number of homes listed/sold under $1,000,000. In fact, there was only one home listed under $1,500,000 in Q1. 21 of the 39 homes had sale prices above $2,000,000 and 9 were above $3,000,000!
If you’re a buyer trying to break into the Mercer Island market, patience and the ability to act fast are the top two tips we have for you. 85% of the 39 homes for sale in Q1 sold within the first 10 days. Working with a local pro will be your biggest advantage.

Click here for the full report and neighborhood-by-neighborhood statistics!
CONDOS – SEATTLE & EASTSIDE
Condos continue to gain ground early in 2022. While the year-over-year median price gains are conservative compared to the single-family market, we see this as a good thing! Condos are a bright spot for today’s home buyers as interest rates rise.
Seattle condos saw a 9% increase (to $519,000). Eastside condos are up 16% (to $625,000) a 26% lift in price per square foot compared to Q1 2021.
Shoreline and East Bellevue led the market in median price gains year over year, up 66% and 48% respectively. Queen Anne and Kirkland were the most conservative with 1% and 4% gains respectively. 85% of Eastside condos sold over the list price, so if you’re shopping be prepared to compete.
Check out area-by-area details the full condo report.
WATERFRONT
If the first three months are any indication, it will be a tight inventory year in the Waterfront real estate market. On all shorelines, there were a total of 17 homes sold overall with an average of only 6 listings for sale at any one time. The good news is that we’re up from this time last year when there were only 14 homes sold overall.
Notably, the highest overall sale (at $12,750,000) was on Lake Sammamish in Issaquah! The most affordable waterfront this quarter was a home in Rainier Beach that sold for $1,362,500.
This brief overview of the entire Seattle-Eastside private waterfront market, including Mercer Island and Lake Sammamish, illustrates the trends occurring in our region over time. This data is interesting and insightful but cannot replace an in-depth waterfront analysis provided by a savvy broker with years of local waterfront experience.
We earn the trust and loyalty of our brokers and clients by doing real estate exceptionally well. The leader in our market, we deliver client-focused service in an authentic, collaborative, and transparent manner and with the unmatched knowledge and expertise that comes from decades of experience.
© Copyright 2022, Windermere Real Estate/Mercer Island. Information and statistics derived from Northwest Multiple Listing Service and deemed accurate but not guaranteed.
How’s the Market? Annual Report on Seattle Area Real Estate…
In the wake of extreme buyer demand and mind-blowing bidding wars, housing prices soared in Seattle and reached staggering heights on the Eastside. Record low interest rates were the silver lining for those buyers who were able to successfully purchase a home with financing.
2022 looks to be another strong year for real estate. Windermere’s chief economist, Matthew Gardner, predicts that interest rates will remain low and home price growth will continue—albeit at a slower, more sustainable rate than we saw in 2021. He also foresees a nice bounce back for our COVID-impacted economy in Q4 of 2022.
Click or scroll down to find your area report:
Seattle | Eastside | Mercer Island | Condos | Waterfront
SEATTLE
The Seattle real estate market, while extremely active in its own right, was far more moderate than the Eastside’s frenzied and nearly unattainable environment.
Seattle’s Median Sale Price increased by 9% to $852,000 (up from $785,000 in 2020). Neighborhoods in Lake Forest Park-Kenmore (+24%) and Shoreline (+16%) outperformed the average, while Queen Anne-Magnolia (+4%) and West Seattle (+7%) lagged behind.
Despite the tight supply of homes for sale, there was a 20% increase in the number of Seattle homes sold in 2021 (11,589) compared to 9,682 sold in 2020. Central Seattle (+31%) and Queen Anne-Magnolia (+22%) had the largest increases in number of homes sold.
79% of all Seattle homes, and 24% of those priced above $1 million, sold at or above the list price.
Homes that sold in their first ten days on the market went for an average of 7% above list price, compared to 4% over if we look at the overall average. The most competitive neighborhoods were North Seattle and Lake Forest Park, with first-ten-day sales averaging 10% above list price.

Click here for the full report and neighborhood-by-neighborhood statistics!

EASTSIDE
To say the 2021 Eastside real estate market was aggressive would be the understatement of the year. Typical home buyers requiring loans to finance their purchases found it nearly impossible to compete with the many cash or cash-equivalent, no contingency offers that often won out. With few exceptions, home buyers had to be willing to sacrifice rights and fail safes—such as inspection contingencies—that are normally taken for granted in a balanced market.
The Eastside’s Median Sale Price was $1,350,000 in 2021, up an unprecedented 32% over 2020 ($1,020,000) as desperately competing buyers drove prices to record levels. Redmond (+38%) and South Eastside (+36%) saw the largest gains, while West Bellevue (+25%) had the lowest—albeit still staggering—year-over-year increase.
89% of all Eastside homes, and 66% of homes priced above one million dollars, sold for at or above their list price. With fewer than 0.3 Months of Inventory (the number of months it would take to sell all homes currently for sale), the entire Eastside market remained ultra-competitive throughout the year. Many Eastside communities have had only a handful of homes for sale at any one time.
Homes sold an average of 7% above list price. For those sold within the first ten days, however, that number spiked to an average of 11% above list price. The most competitive neighborhoods were East Bellevue and South Eastside, with first—ten-day sales averaging 14% and 13% above list price, respectively.

Click here for the full report and neighborhood-by-neighborhood statistics!
MERCER ISLAND
Fewer than two dozen homes for sale on the Island at any given time in 2021 led to a continued ultra-competitive market. Waterfront, in particular, saw very steep increases during the year as the laws of supply and demand deftly governed prices.
Echoing the extreme price increases seen throughout the Eastside, Mercer Island’s Median Sale Price shot up by a staggering 29% over the last year. It’s worth noting, however, that this number was skewed upward by the unusually high number of luxury waterfront sales.
In 2021, 82% of all homes sold at or above their listed price. Those sold in the first 10 days on market closed for an average of 10% above their list price. On the other hand, homes on the market 11-30 days sold for an average of 2% below their list price list and homes on the market longer than 30 days sold for an average of 6% below their list price.

Click here for the full report and neighborhood-by-neighborhood statistics!
CONDOS – SEATTLE & EASTSIDE
Seattle condos saw a Median Sale Price increase of 2% (to $490,000) and Eastside condos saw a 5% increase (to $550,000) in 2021. 46% of Seattle condos and 67% of Eastside condos sold in the first ten days on the market.
60% of Seattle condos and 77% of Eastside condos sold at or above their listed price. Those sold in the first 10 days on the market went for an average of 2% and 5% above their list price, respectively.
On the Seattle side, Shoreline condos saw a 43% increase—and on the Eastside, Sammamish and Redmond condos saw a 20% increase—in Median Sale Price driven by both new construction and buyer demand. West Bellevue saw an 18% decrease due to the lack of significant new construction following the debut of luxury new construction in 2020.
Check out area-by-area details the full condo report.
WATERFRONT
There were 170 privately-owned waterfront home sales in the greater Seattle-Eastside region in 2021 (Eastside 59; Seattle 48; Lake Sammamish 36; Mercer Island 27).
The waterfront home market continues to see incredible buyer demand coupled with an extreme shortage of available waterfront homes for sale. As an indicator of demand in the luxury segment, most homes sold near to or above their list price with few outliers—something that historically has rarely happened in this sector.
This brief overview of the entire Seattle-Eastside private waterfront market, including Mercer Island and Lake Sammamish, illustrates the trends occurring in our region over time. This data is interesting and insightful but cannot replace an in-depth waterfront analysis provided by a savvy broker with years of local waterfront experience.
We earn the trust and loyalty of our brokers and clients by doing real estate exceptionally well. The leader in our market, we deliver client-focused service in an authentic, collaborative, and transparent manner and with the unmatched knowledge and expertise that comes from decades of experience.
2737 77th Ave SE, Mercer Island, WA 98040 | (206) 232-0446
mercerisland@windermere.com
© Copyright 2022, Windermere Real Estate/Mercer Island.
How’s the Market? Q3 Real Estate Review

The frenetic pace of Seattle-area real estate continued in Q3, with the number of sales and median sales prices both up across the region compared to this time last year. Seattle condo sales saw a healthy year-over-year jump as they continued to recover from the COVID slump we saw in 2020.
While buyers still contended with a lack of inventory and stiff competition for available homes, our continued low interest rates were the silver lining. Those obtaining financing were buoyed up by lower mortgage payments and increased buying power compared to times when rates are higher.
Click or scroll down to find your area report:
Seattle | Eastside | Mercer Island | Condos | Waterfront
SEATTLE
Seattle’s Median Sale Price increased by 8% to $865,500 (up from $800,000 in Q3 2020). Neighborhoods in Lake Forest Park-Kenmore (+19%), Shoreline (+13%), North Seattle (+10%), West Seattle (+10%), and Queen Anne-Magnolia (+9%) outperformed the average while South Seattle (+8%) stayed on par and Ballard-Green Lake (+5%) and Central Seattle (+2%) lagged behind.
There was an 8% increase in the number of Seattle homes sold in the third quarter of 2021 (3171) compared to Q3 2020 (2929) despite the tight supply of homes for sale. Central Seattle (+20%) and North Seattle (+18%) had the largest increases over Q3 2020 in number of homes sold.
79% of all Seattle homes, and 28% of those priced above $1 million, sold at or above the list price. The average of all homes sold closed at a price 4% more than list. Price increases were even more dramatic when homes sold in their first ten days on the market—with an average sale price of 7% above list price. The most competitive neighborhoods were North Seattle and South Seattle, with first 10-day sales averaging 9% and 8% above list price, respectively.

Click here for the full report and neighborhood-by-neighborhood statistics!

EASTSIDE
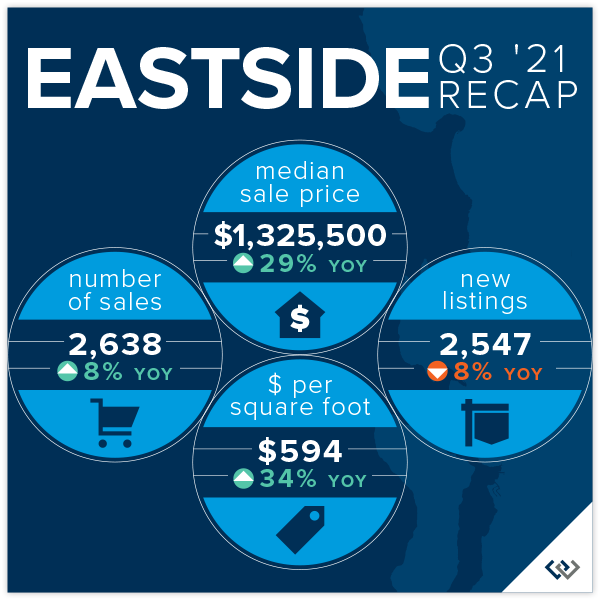
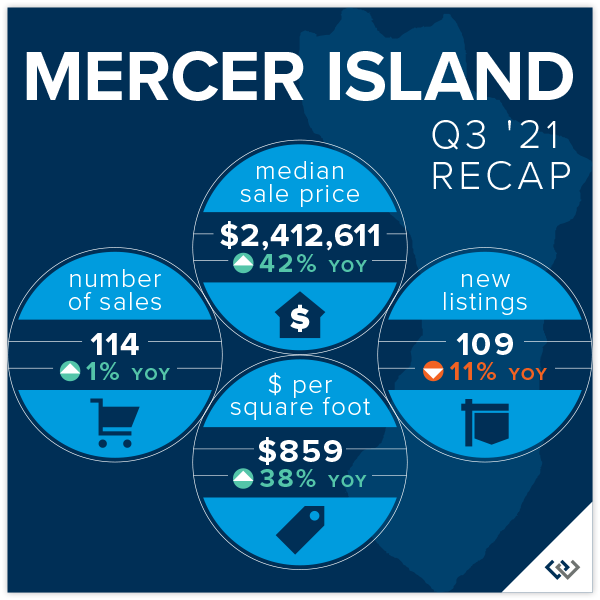
The Eastside’s Median Sale Price was $1,325,500 in the third quarter of 2021, up 29% over Q3 2020 ($1,025,100). Buyer demand outpacing the supply of homes for sale was the biggest factor fueling this increase. Mercer Island, (+42%), Redmond (+32%), Sammamish (+32%), and South Eastside (+32%) saw the largest gains, while Woodinville (+23%) had the smallest year-over-year increase.
87% of all Eastside homes, and 65% of homes priced above one million dollars, sold for at or above their list price. With 59% fewer homes for sale than in Q3 2020, the entire Eastside market remained ultra-competitive. The average of all homes sold was 7% above list price. Homes sold within the first ten days went for an average of 11% above list price. The most competitive neighborhoods were East Bellevue and South Eastside, with first 10-day sales averaging 13% and 12% above list price, respectively.
The Eastside market saw Months of Inventory (the number of months it would take to sell all homes currently for sale) remain at historical lows of between 0.3 and 0.4 months. Many Eastside communities have had only a handful of homes for sale at any one time.
Click here for the full report and neighborhood-by-neighborhood statistics!

MERCER ISLAND
Fewer than two dozen homes for sale on the Island at any given time has led to a continued ultra-competitive market and unpredictable shifts in median sale price as a result. It’s worth noting that a few very high-end waterfront home sales skewed the median sale price upward as compared to last year.
In the third quarter of 2021, 75% of all homes sold at or above their listed price. Sellers who prepped and priced their homes competitively reaped huge rewards from bidding wars—those that sold in the first 10 days on market closed for an average of 10% above their list price.
On the other hand, those properties that were not immediately snapped up tended to sell at a discount. Homes on the market 11-30 days sold for an average of 3% below their list price, while homes on the market longer than 30 days sold for an average of 5% below their list price. Pricing and condition tended to separate the “haves” from the “have nots” when it came to selling quickly.
Click here for the full report and neighborhood-by-neighborhood statistics!

CONDOS – SEATTLE & EASTSIDE
Condos did quite well overall in the third quarter of 2021 as single-family home markets became more competitive, and in some cases, unattainable.
Seattle condos saw a 3% increase (to $492,750) and Eastside condos saw a 10% increase (to $551,619) in Median Sale Price compared to Q3 2020.
62% of Seattle condos and 78% of Eastside condos sold at or above their listed price. Those sold in the first 10 days on the market went for an average of 2% and 5% above their list price, respectively.
Check out area-by-area details the full condo report.

WATERFRONT
The waterfront home market continues to see incredible buyer demand while also suffering from an extreme shortage of available homes for sale. Nearly every waterfront home listed for sale sold in record time, some for jaw-dropping prices. The Eastside had 23 waterfront home sales in the third quarter of 2021 while Seattle had 22 Q3 waterfront sales, Mercer Island had 15, and Lake Sammamish had 10 waterfront sales. More than half of waterfront homes listed for sale went under contract in mere days, with an average market time still a fraction of that of a more typical year.
As an indicator of demand in the luxury segment, with few outliers, most homes sold near to or above their list price—something that historically has rarely happened in this sector.
This brief overview of the entire Seattle-Eastside private waterfront market, including Mercer Island and Lake Sammamish, illustrates the trends occurring in our region over time. This data is interesting and insightful but cannot replace an in-depth waterfront analysis provided by a savvy broker with years of local waterfront experience.
We earn the trust and loyalty of our brokers and clients by doing real estate exceptionally well. The leader in our market, we deliver client-focused service in an authentic, collaborative, and transparent manner and with the unmatched knowledge and expertise that comes from decades of experience.
© Copyright 2021 Windermere Mercer Island
How’s the Market? Q2 Real Estate Review

Buyers found no relief as our region’s extreme sellers’ market continued skyward. Strong home buyer demand simply outpaced the number of available properties for sale. Fierce competition drove prices up 15% in Seattle and a staggering 38% on the Eastside as compared to Q2 of 2020. While COVID played a factor in early 2020; all things considered, prices have increased substantially in the first half of 2021.
Home affordability, or unaffordability, is one of the most significant factors impacting our communities. Many first-time buyers, retirees, and moderate wage earners are finding the tri-county region of King, Snohomish, and Pierce Counties simply out of reach…or find themselves settling for accommodations that are far less than expected. The Seattle area, much like other high-priced markets across the country, has become a region where only the affluent can afford to own real estate.
As we move into the summer, buyer fatigue, coupled with COVID reopening of recreation and vacation opportunities, may provide much needed dampening of buyer demand. Our market desperately needs more balance between buyers and sellers in the market.
Click or scroll down to find your area report:
Seattle | Eastside | Mercer Island | Condos | Waterfront
SEATTLE
Seattle’s Median Sale Price increased by 15% to $895,000 (up from $780,000 in Q2 2020). North end neighborhoods in Shoreline (+37%), Lake Forest Park-Kenmore (+37%), and North Seattle (+18%) outperformed the average while South Seattle (+9%), West Seattle (+11%). and Central Seattle (+12%) lagged slightly behind.
There was a 74% increase in the number of Seattle homes sold in Q2 (3,404) compared to Q2 2020 (1,956)—much of which can be attributed to COVID-related factors. Central Seattle (+116%) and West Seattle (+90%) had the largest increases in number of homes sold.
86% of all Seattle homes, and 33% of those priced above $1 million, sold at or above list, with the average of all homes sold at prices 6% more than list. Price increases were even more dramatic when homes sold in their first ten days on the market (76% of all listings) with an average sale price of 10% above list price. The most competitive neighborhoods were Kenmore-Lake Forest Park and North Seattle, with first 10-day sales averaging 15% and 13% above list price, respectively.

Click here for the full report and neighborhood-by-neighborhood statistics!
EASTSIDE
The Eastside’s Median Sale Price was $1,320,355 in Q2, up 38% over Q2 2020 ($958,000). Buyer demand outpacing the supply of homes for sale was the biggest factor fueling this increase. Redmond, (+48%), Kirkland (+48%), and South Eastside (+45%) saw the largest gains, while West Bellevue (+7%) had the smallest year-over-year increase.
93% of all Eastside homes, and 68% of homes priced above one million dollars, sold for at or above their list price. With 70% fewer homes for sale than in Q2 2020, the entire Eastside market remained ultra-competitive. The average of all homes sold was 9% above list price and homes sold within the first ten days went for an average of 13% above list price.
The Eastside market saw Months of Inventory (the number of months it would take to sell all homes currently for sale) remain at historical lows of between 0.3 and 0.4 months. Many Eastside communities have had only a handful of homes for sale at any one time.

Click here for the full report and neighborhood-by-neighborhood statistics!
MERCER ISLAND
Fewer than two dozen homes for sale on the Island at any given time has led to a continued ultra-competitive market with 90% of all homes sold at or above their listed price. Those sold in the first 10 days on market (77% of all sales) closed for an average of 13% above their list price. Homes on the market 11-30 days sold for an average of 1% above list and homes on the market longer than 30 days sold for an average of 4% below their list price.
Click here for the full report and neighborhood-by-neighborhood statistics!

CONDOS – SEATTLE & EASTSIDE
Condo demand surged in Q2 as single-family home markets became more competitive, and in some cases, unattainable.
Seattle condos saw a 7% increase (to $488,750) and Eastside condos saw a 5% increase (to $550,000) in Median Sale Price compared to Q2 2020. Fueled by new construction development, South Seattle saw a three-fold increase in the number of condos sold, while the number of West Bellevue condos sold was up nearly double.
61% of Seattle condos and 80% of Eastside condos sold at or above their listed price. Those that were sold in the first 10 days (48% of Seattle and 70% of Eastside sales) sold for an average of 2% and 5% above their list price, respectively.
Check out area-by-area details the full condo report.
WATERFRONT
Waterfront listings were swooped up by buyers nearly as quickly as they came to market, some for staggering margins. Lake Sammamish had a record 18 sales while the Eastside had 17, Seattle 14, and Mercer Island had 7. Many waterfront homes went under contract in mere days, with an average market time in the teens instead of months.
As an indicator of demand in the luxury segment, most homes sold above their list price—something that historically has rarely happened in this sector. Some of most competitive homes sold for outrageously more than their list price as affluent buyers opened their pocketbooks for the win.
This brief overview of the entire Seattle-Eastside private waterfront market, including Mercer Island and Lake Sammamish, illustrates the trends occurring in our region over time. This data is interesting and insightful, but can’t replace an in-depth waterfront analysis provided by a savvy broker with years of local waterfront experience.
Find a Home | Sell Your Home | Property Research
Neighborhoods | Market Reports | Our Team
We earn the trust and loyalty of our brokers and clients by doing real estate exceptionally well. The leader in our market, we deliver client-focused service in an authentic, collaborative, and transparent manner and with the unmatched knowledge and expertise that comes from decades of experience.
2737 77th Ave SE, Mercer Island, WA 98040 | (206) 232-0446
mercerisland@windermere.com
© Copyright 2021, Windermere Real Estate/Mercer Island. Information and statistics derived from Northwest Multiple Listing Service and deemed accurate but not guaranteed.